Invest1 publisher3 min readPublished
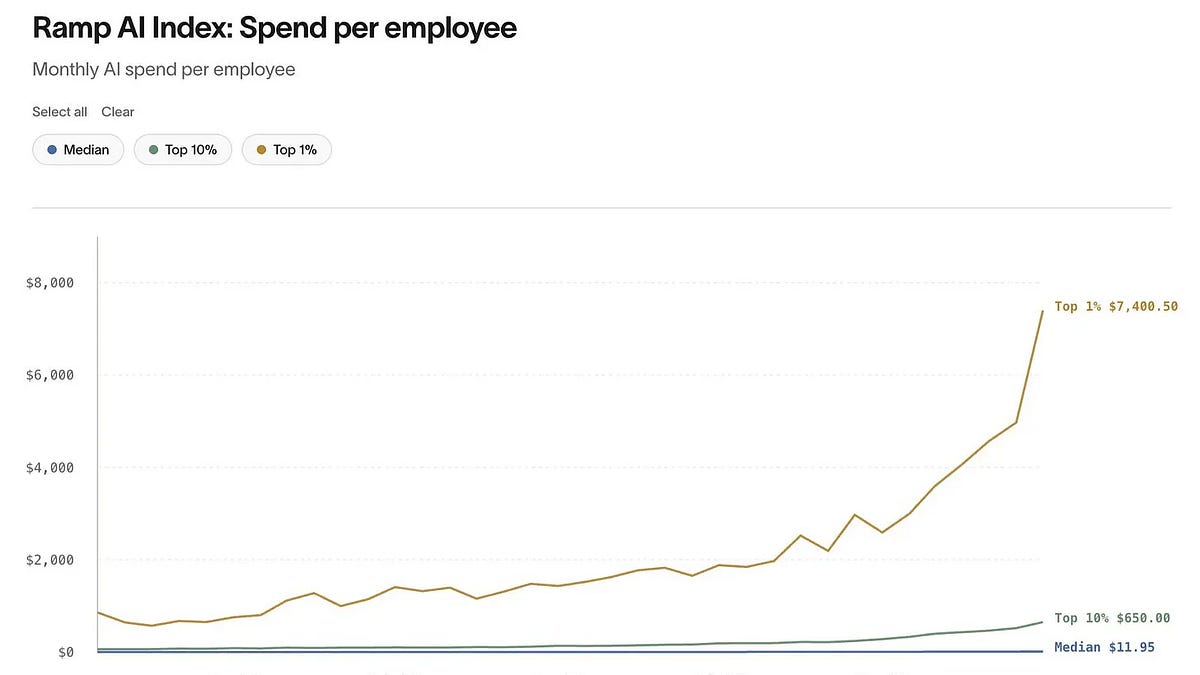
Ramp's 80%-from-1% figure travelled fast, but the spend table underneath it prices the trade better, because the top percentile's $7,400 per employee per month is a wage bill rather than a software line.
The Investor · Invest desk

Compiled by The InvestorSomething wrong?How this is made
Divide $7,400 by $11.95 and the top percentile of Ramp's panel is buying AI at 619 times the median American business, per employee per month [5][16], with another 11.4 times separating that percentile from the top decile beneath it [17]. Annualised, the leaders are paying $88,800 per employee per year [18], which sits at wage scale rather than software scale, and Giovanni Cattani's taxonomy says it should, because in his words "Demand for AI is ultimately demand for labor" [8][7].
That is also why the median line is unlikely to close the gap. Bounded work produces cost-saving returns and, Cattani argues, "converge[s] on the cheapest possible option" [9], so a smarter model does not lift the accountant's seat above $11.95 [5]; it lowers the clearing price. The revenue that pays for the frontier has to come from unbounded, long-horizon tasks, and he counts three of them, AI research, software engineering and trading, at roughly half of all frontier inference revenue [10], with the horizon axis borrowed from METR, where o3 runs about thirty minutes unattended and Mythos about three hours [12]. Each of the three is reflexive by construction: "Larger spend on tokens yields more revenue and a stronger balance sheet, which is spent on more tokens" [11].
Hold that against the $80 billion of compute Anthropic signed for in the last two months [6]. The newsletter maps Ed Zitron's "few hundred companies" onto Ramp's one percent [13][14], and one percent of 70,000 firms is 700 [19], so the commitment works out to about $114 million per firm at 700 and about $267 million at 300 [19]. The bases do not match, since Ramp's percentile spans two labs and the compute is one lab's, but the order of magnitude is the point, or rather the point is what it forecloses: capacity of that size is being underwritten against a customer census you could fit in a mid-sized conference.
Three things would break this read. The median could move, and a $11.95 line that doubles or triples on Ramp's next print would say bounded work is becoming a volume business rather than a rounding error [5]. The mix could sit off-panel, because the figure is business revenue observed on card and bill-pay rails, and nothing in the data says what share of total lab revenue those rails carry, or names a single buyer [1][21]. And Ara Kharazian's own wording is looser than the summary it produced: the top percentile "skew[s] heavily toward the tech sector and AI products and services" [3], which is not the same claim as the labs selling to themselves. What the evidence does carry is his benchmark, that this is concentration "unseen in any other software category we track" [2], against a norm where twenty percent from the top ten customers is unremarkable and forty percent from three is a yellow flag [15]. So the correlation question he asks, ahead of the OpenAI and Anthropic listings [4], is the one to price: the equity on offer carries the beta of its own customer list. The cheapest test is the median. If $11.95 has barely moved next month, the frontier is still being paid for by the frontier [5].
Ranked by verification strength, evidence, and original report placement.
Ramp's card and bill-pay data across 70,000 American companies shows 80% of OpenAI's and Anthropic's business revenue comes from 1% of their customers; published by Ramp's lead economist Ara Kharazian.
Kharazian called it "a level of concentration risk unseen in any other software category we track."
Kharazian said the top one percent of customers "skew heavily toward the tech sector and AI products and services."
Kharazian: "what happens in a market correction? All these companies are highly correlated, and an increasing share of our economy is invested in them. Especially as we approach blockbuster IPOs for OpenAI and Anthropic."
In July, the median American business on Ramp spent $11.95 per employee per month on AI; the top 10 percent spent $650; the top 1 percent spent $7,400.
Giovanni Cattani published his taxonomy of AI demand in a long X article that pulled 670,000 views, a day before Ramp published its concentration number.
Follow any of these and your For You feed starts watching them — no settings page required.
Evidence-backed comparisons of source perspectives and observed adoption signals. Read the methodology
Which Builder, Operator, and Investor concerns the observed source mix emphasized—not a truth score.
Evidence, demonstrated adoption, hype gap, incentives, and confidence are assessed independently, each on its own current evidence. How these are measured.
Named source, boundary left undrawn
The 80% figure carries a named source and a described dataset, and the spend table's ratios hold up under arithmetic; even so, Ramp's original post, its method, and the single number that would fix the figure's meaning, how much of either lab's revenue passes over those rails at all, are all missing. The two supporting assertions, Anthropic's $80 billion of compute and the enterprise-software concentration thresholds, also carry no citation whatever.
Money that actually moved, thin at the median
Card and bill-pay records beat survey intent, because the spend already cleared. What those records show is a median business at $11.95 per employee per month, which buys one seat of something for someone in finance, while the top percentile at $7,400 is paying wage-bill rates for inference as an input. Participation is broad but depth is shallow, and any spend that never touches a Ramp card simply does not show up in these numbers.
One rail read as the whole book
The number is business spend seen by one card issuer, yet it travelled as a statement about OpenAI's and Anthropic's revenue, and nobody repeating it, including this reporting, states what fraction that spend actually represents. CO/AI pushes in the opposite direction on the substance, arguing the demand side is the supply side in another badge, so the overstatement sits in the framing and in two uncited props rather than in the analysis.
Everyone quoted gains from the retelling
Ramp sells spend management and published the dataset that demonstrates how much of company spending it can see. Cattani's taxonomy earned 670,000 views the day before the number landed. Zitron's readership is built on bubble scepticism, and the newsletter got a coherent week out of stacking the three. None of that makes the figures wrong, but there is no disinterested party in the sourcing.
Single newsletter, primaries unseen
Every fact here reaches us through one newsletter, whose text breaks off mid-sentence on what Anthropic shipped on Tuesday. The quotations are specific enough to be checkable and the arithmetic is ours to verify, so the floor is solid; still, nobody has produced Ramp's post, a lab comment, or a second outlet checking the same data, which is why the ceiling stays low.
build
Identical B200 clusters are repricing 50-60% higher instead of falling, investor says1 publisher
invest
OpenAI outgrows Anthropic in Q3 to date across Ramp's 70,000-business panel1 publisher
invest
OpenAI's 14 exits land on the two seats a $1T listing has to defend1 publisher
invest
Alice's $140M round prices a decade of abuse data at seven to eight times revenue3 publishers
Publishers with included, body-backed reporting in this cluster.
1 article · September 6, 2026