Build1 distinct publisher3 min readPublished
The waste never surfaced as an error, because the agents retried until the task finished anyway. Pricing it took a trace carrying token counts and a session ID, which Databricks already collected on the path of every call.
The Engineer · Build desk

build
Bedrock's managed agentic retrieval nests a second loop inside the call your RAG logs count as one1 distinct publisher
build
A gate that warns and a fan that queues: test the executor, not the card1 distinct publisher
product
Dash0 buys Polar Signals, and GPU kernel profiling stops being a specialist purchase1 distinct publisher
build
JetBrains ships its OpenTelemetry plugin to four more IDEs; instrumentation is still your problem1 distinct publisher
Compiled by The EngineerSomething wrong?How this is made
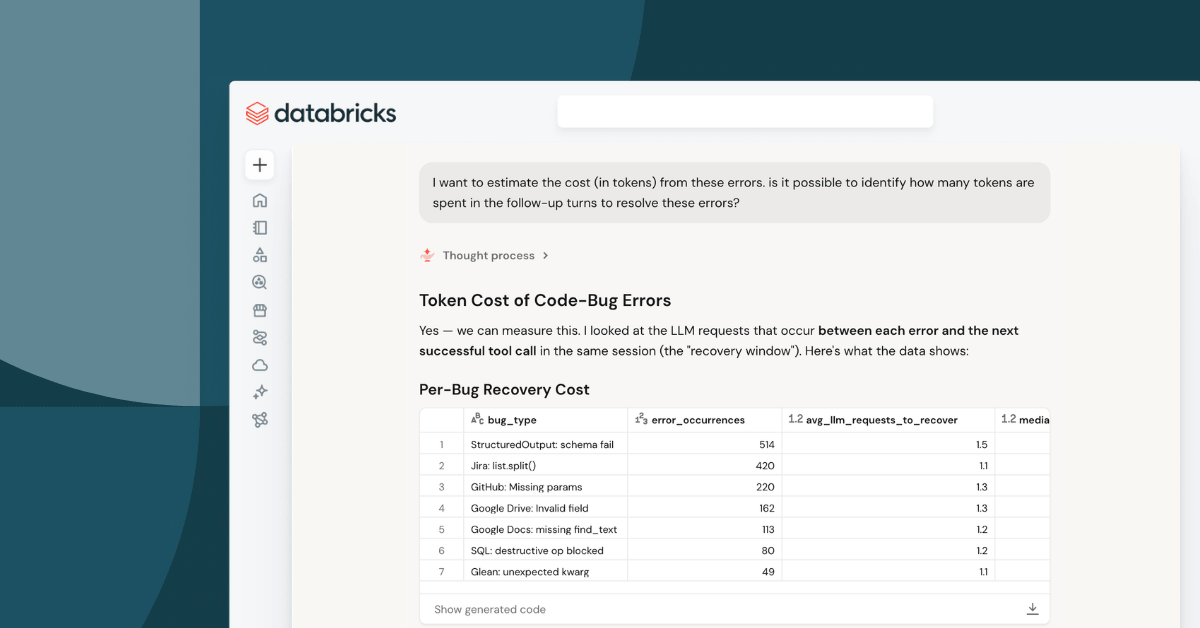
What actually gets billed is the retry, and the underlying error never shows up on an invoice. Databricks says a misbehaving tool rarely makes the calling agent fail loudly; the agent retries, guesses and eventually routes around the problem, burning tokens the whole way [3]. From the outside the task still completes, and the cost lands in an aggregate dashboard as a token bump that reads like usage growth [4]. The load-bearing field in the gateway's trace turns out to be the session ID, which ties calls together and sits on the same span as the per-call token count [8], rather than the error string itself. Error logs give you a ranked bug list, but only the session data shows how many model calls one bad `.split()` actually bought.
The headline total is two kinds of money stapled together. Subtract the $499K token estimate from the $1.2M and the 12,000 hours are carrying roughly $701K, which implies a wait-time rate near $58 an hour [2]. Databricks does not publish that rate; it falls out of the two figures it does publish. Only the token half arrives as an invoice. The rest is about 5.8 engineer-years of waiting on a 2,080-hour year [4], and it becomes cash only if the waiting displaced work someone would otherwise have paid for.
Per bug, the average is about $71K a year [1]. The worst one ran 535 failures a day, call it 195,000 a year [3]. The cause: the Jira `issues.search` server expected a comma-separated string like `key,summary,status` for its `fields` parameter, the model sent an array because that is the semantically natural JSON type for a list of fields, and a list has no `.split()` [6][7]. That missing type check ended up costing more than any other line in the fleet.
For the $499K to transfer to your fleet, a few conditions have to hold at once. A tool has to be called hundreds of times a day before a schema mismatch turns into a five-figure item, which is a matter of volume. The wrappers have to be hand-written code sitting over SaaS APIs where a parameter's type is genuinely ambiguous, which is what the sample was, drawn from Jira and Google Drive/Docs servers in one 24-hour window [12]. And, where most shops stop, something has to already sit on the path of every tool call emitting tokens, arguments and session IDs without any per-agent instrumentation [9]. Databricks says it could not manage or even fully understand these costs before that existed [13].
The hour will get quoted [10]. The part worth copying is that the trace existed before anyone had a question, which is why the analysis was reading answers rather than schema spelunking [11]. And the design conclusion is cheap to adopt now: models guess on ambiguous inputs, so accept the variation rather than crash on it [14].
Ranked by verification strength, evidence, and original report placement.
Databricks found seven small bugs in its MCP tool servers costing an estimated $499K/year in wasted tokens across its agent fleet.
Databricks attributes about 12,000 engineering hours per year of agent wait time to the same seven bugs, for an estimated $1.2M/year in lost productivity overall.
When tools misbehave the calling agent rarely fails loudly; instead it retries, guesses and eventually works around the problem, quietly burning tokens and developer time.
From the outside the task still completes, and an aggregate cost dashboard may show a 10% bump in token spend that is easily misinterpreted as usage growth.
The highest-volume of the seven bugs produced 535 failures a day, in the Jira issues.search tool.
The Jira issues.search tool's fields parameter expected a comma-separated string such as "key,summary,status", but the model passed an array, the semantically natural JSON type for a list of fields, inferred from JSON conventions and adjacent tool calls in the same session.
Distinct publishers with included, body-backed reporting in this cluster.
1 article · September 1, 2026
Follow any of these and your For You feed starts watching them — no settings page required.
Evidence-backed comparisons of source perspectives and observed adoption signals. Read the methodology
Which Builder, Operator, and Investor concerns the observed source mix emphasized—not a truth score.
Evidence, demonstrated adoption, hype gap, incentives, and confidence are assessed independently, each on its own current evidence. How these are measured.
Vivid mechanism, unaudited arithmetic
The engineering half of this is unusually checkable: a named tool, the literal string "'list' object has no attribute 'split'", 535 failures in a day, 49.6% of drive_file_get calls failing on field names, an average of twelve turns to recover. Detail like that is hard to invent. The money is a different animal — $499K in tokens and $1.2M all in are projections built off one 24-hour window, with no fleet size, no token price and no hourly rate shown, and the company reporting them also owns the tooling. One post, one party, no outside check.
One fleet, its own house
Everything observed here happens inside Databricks: its gateway, its agents, its Jira and Drive tool servers, its coding agents shipping the patches. No customer, partner or outside team appears anywhere using this path, and there is no sign of how widely the tracing or the natural-language analysis is used beyond the internal fleet. It is an existence proof, and a well-documented one, but a sample of one.
Diagnosis earns it, invoice doesn't
Two things are stacked here and they carry different weight. That agents silently retry past broken tools, and that this reads as growth on a spend chart, is a genuinely under-discussed problem and the story treats it seriously. "$1M eliminated in one hour" is the part that outruns its evidence: it annualizes a day of traces, prices engineer waiting at a rate never named, and books the saving before any after-the-fix spend measurement appears. The headline number would need a footnote; the failure mode would not.
The tooling is the point
Follow the moral of the story and you arrive at a purchase order. The narrative only works if you have gateway-level traces on every tool call and a natural-language layer over them — Unity Gateway and Genie One, both Databricks products — and the savings figure sits in the headline rather than a methodology note. The bugs are plainly real; what is chosen is the framing that makes them a demonstration.
Trust the bug, discount the total
We would act on the technical finding tomorrow and quote the dollar figures only with a caveat. The array-versus-string mismatch, the useless traceback and the quiet retry loop are described precisely enough to check against your own traces. The totals hinge on an hourly rate that has to be reverse-engineered at roughly $58 and on stretching twenty-four hours across a year, with no second source anywhere in this reporting to test either.