Science1 distinct publisher3 min readPublished
A three-year model of one Ottawa neighborhood was finished before the July 1 downpour arrived, so its authors fed it the real rainfall record instead of a code storm, and the answer turned on where the gardens sat rather than how much land they took.
The Scientist · Science desk

Compiled by The ScientistSomething wrong?How this is made
The reason a cell in the curb strip outperforms one behind a house is geometric rather than horticultural. Right-of-way gardens sit on the routes water already takes as it runs downhill [12], so they intercept flow gathered from many parcels instead of the rain that fell on one. The timing makes the point better than the totals do. In the do-nothing run, flooded area more than tripled between 2 p.m. and 2:45 p.m. as the drainage system gave out; in the street-garden run it leveled off around 2 p.m. and receded from there [11].
Set the areas side by side and the gap is wider than the percentages suggest. Private lots took peak ponding from 8.4 hectares to 6.2 [7][8], removing 2.2 hectares. The right-of-way run took it to 2.0 [9], removing 6.4, roughly 2.9 times as much on less land [2]. Adding private lots on top of street gardens bought a further 0.8 hectares, taking the reduction from 76% to 86% and the deepest water from about 1.5 meters to just over 1 [10][3]. The denominator is modest: 8.4 hectares at 12% puts Crystal Beach at about 70 hectares [1].
The thing this does not tell you is what happened in basements. The storm's signature damage in Ottawa was close to 5,800 basement flooding reports, concentrated in the west end [2], and the model's flood metric is surface depth, water reaching 15 centimeters above ground, chosen as roughly doorstep height [6], with velocity above 0.6 meters per second tracked separately as a hazard [13]. The nearest proxy for sewer surcharge is the pipe result: with gardens in both locations, total runoff volume fell 80% and peak flow through the network was nearly halved [14]. That is consistent with fewer flooded basements. It is not a measurement of them.
The mechanism the authors are arguing for is upstream of all this. Pipes move water faster once it has pooled but do not change how much arrives; a garden intercepts rainfall before the sewer sees it [15]. Their own caveat is the one to hold onto: these are modeled results, and models are kinder to stormwater controls than field monitoring is [18]. Treat 76% as the ceiling of a design study.
What travels here is less the number than the setup. The model was three years in the making before July 1 [3], which means the storm was not selected to suit it, and the 167 millimeters that fell in five hours [1] averages about 33 millimeters an hour [4], well past what standard drainage is sized for [20]. Within one neighborhood and one rainfall record, placement beat coverage; whether that ordering survives different topography is a question the work does not claim to settle [17].
Ranked by verification strength, evidence, and original report placement.
Ottawa was hit with 167 millimeters (6.6 inches) of rain in five hours earlier in the summer, in what the city called a 1-in-200-year event.
Close to 5,800 reports of basement flooding followed the storm, with the worst of it in Ottawa's west end, including the Crystal Beach neighborhood.
The researchers had already spent three years building a computer model of Crystal Beach before the July 1 storm.
Instead of a hypothetical storm, they ran the actual July 1 rainfall record through the model four times: the neighborhood as it stands, with rain gardens on private lots, with gardens along streetside municipal rights-of-way, and with gardens in both places at once.
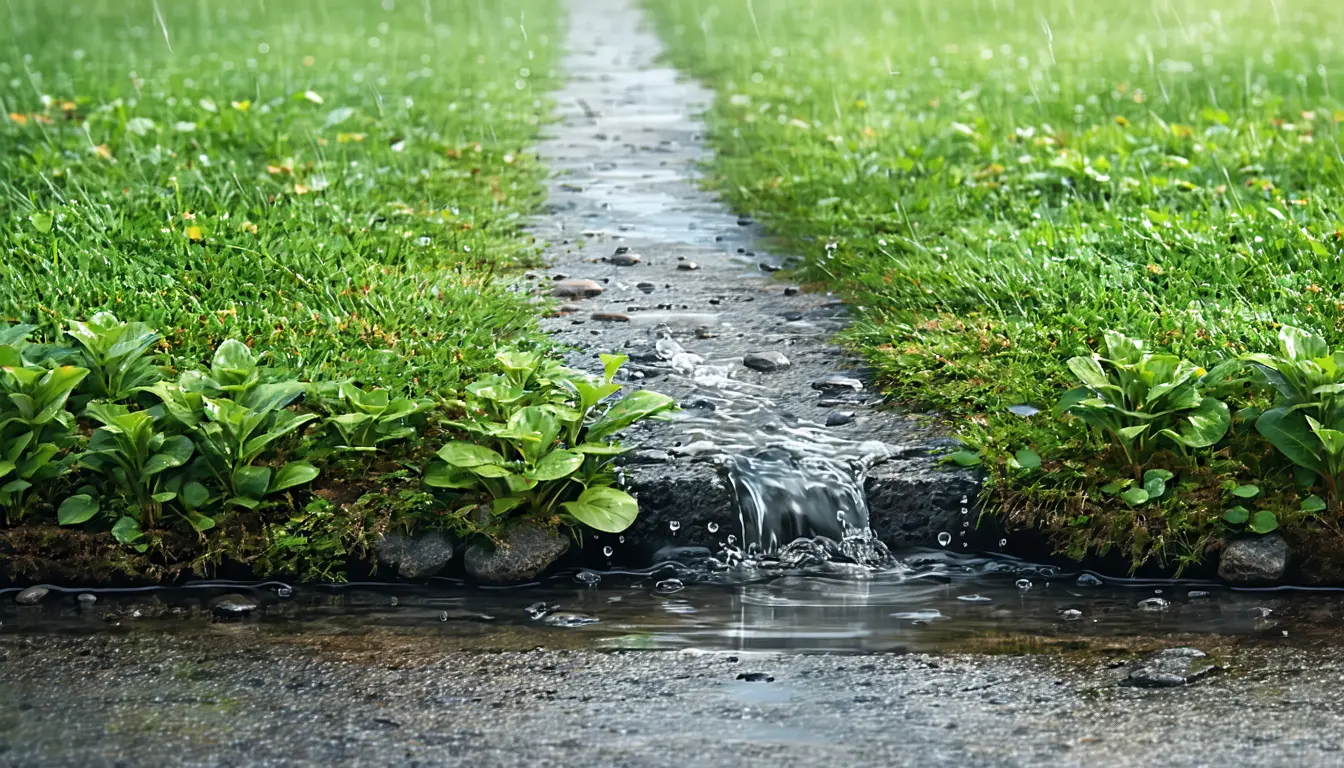
A rain garden, or bioretention cell, is a shallow sloped area filled with plants and soil that takes runoff from a roof or road instead of a catch basin; some water soaks away, some drains out over a few hours, and the rest reaches the sewer.
Ground counted as flooded once water reached 15 centimeters (6 inches) above ground, a threshold widely used in urban flood modeling because it is roughly the height of a doorstep, the point at which water starts getting into buildings.
Distinct publishers with included, body-backed reporting in this cluster.
phys.org
1 article · September 3, 2026
Follow any of these and your For You feed starts watching them — no settings page required.
invest
Alaska's disappearing lakes make permafrost thaw an asset-level observable1 distinct publisher
science
HIPAA Covers Less Than You Think, And "Anonymized" Is Not A Legal Shield1 distinct publisher
science
Whale-watch footage catches 1,417 humpbacks feeding along a corridor theory calls a fast1 distinct publisher
science
Sex has at least five axes. Eligibility rules and reference ranges have one field.2 distinct publishers
Evidence-backed comparisons of source perspectives and observed adoption signals. Read the methodology
Which Builder, Operator, and Investor concerns the observed source mix emphasized—not a truth score.
Evidence, demonstrated adoption, hype gap, incentives, and confidence are assessed independently, each on its own current evidence. How these are measured.
Peer-reviewed, self-reported, unchecked by anyone else
Every figure that matters — 8.4 hectares, 76%, 1,095 square metres — reaches us from one team describing its own model in its own words, with the Journal of Hydrology paper cited by DOI but never quoted. Two things lift this above a press release: the model was three years old before the storm arrived, so the rainfall record could not have been picked to flatter it, and the authors volunteer their own discounts. What is missing is anyone outside the authorship — no calibration statistics, no check of the modelled flooding against Ottawa's 5,800 basement reports, no second publisher.
Nothing planted yet
Two things have actually happened: it rained hard on July 1, and a paper came out. Neither is uptake. Our coverage never says whether Ottawa has built a single right-of-way garden, budgeted for one, or intends to, and no other municipality is mentioned as acting on the finding — so there is no deployment to score, and inventing one from the recommendation would be guessing.
The percentages will outlive the caveats
'76%' and 'models are kinder to stormwater controls than field monitoring is' sit in the same piece, and only one of them will be quoted a year from now. To the authors' credit the scope is stated honestly — one neighbourhood, one afternoon, one low-lying pocket still under water at the peak, gardens that silt up if nobody maintains them — but crisp scenario percentages from an unreplicated model read like an engineering guarantee, and nothing described here has been dug, planted or measured. The overstatement is structural rather than authorial.
Authors arguing for their own study, in the open
This is a researcher byline, and the interest is the least concealed kind: the people who spent three years on the model are the ones telling you placement beats area, and their recommendation — start on land the city already owns — is also the version of the finding a municipality could fund next. There is no vendor, no product and no procurement in view, and the authorship and journal are disclosed at the top and bottom of the piece, so the pull runs toward emphasis and selection of the striking scenario rather than toward distortion.
Coherent, unreplicated, untested in the ground
One publisher, one team, one storm, zero installations. The internal logic does hold together — the timing curve, the velocity thresholds and the runoff volumes all move the same way the placement argument says they should, which is why the story is worth reading at all. But nothing in our coverage would change if the model turned out to be wrong, and that is the whole limit on how far to trust it.