Product1 publisher3 min readPublished
ORNL's LandScan Mosaic estimates global population building by building
Oak Ridge's dataset uses building height, floor count and use type to place people across a 24-hour average, and it reports how confident it is in each estimate. For siting work, that confidence figure matters as much as the count.
The Product Desk · Product desk
What happened
- ORNL built LandScan Mosaic, a global population dataset that merges building data, land-use information and machine learning, as an extension of its annually updated LandScan Global product.
- Mosaic estimates where people are from buildings rather than from pixels of satellite imagery, and publishes an ambient population, the average number of people at a location over 24 hours.
- ORNL says the dataset gives greater temporal and location specificity than LandScan Global and also measures uncertainty, reporting how confident the researchers are in each estimate.
- Lead author Daniel Adams said Mosaic is the first globally available population dataset released with this set of characteristics, in work published in Scientific Reports.
Compiled by The Product DeskSomething wrong?How this is made
Why it matters
- capability A depot, clinic or store siting score can weight a candidate location by what the buildings around it are used for, instead of treating a one-kilometre cell as evenly full.
- decision The uncertainty estimate pushes a design decision onto whoever ships this: show users a range and teach them to read it, or collapse it to one number and absorb the error silently.
- exposure Because attributes are machine-learned where records are missing, accuracy varies with local building-data coverage, and the team that integrates the dataset answers for the thin geographies.
A single LandScan Global cell runs roughly 0.6 miles across, wide enough to contain a primary school and a distribution warehouse, and both sit inside one population number [4][18]. That works for a national estimate but not for deciding which of two depots to staff before dawn.
Mosaic puts the building in place of the pixel. The ORNL team classifies what each structure is for, then maps how residential, commercial and industrial buildings fill and empty across the day [3][7]. Andrew Zimmer, a geospatial scientist at ORNL, uses schools as the example. "For example, there is a certain age group that attends schools," he said. "So, when we're building a demographic dataset, we can use the function of buildings at a fine spatial resolution to inform the distribution of those younger populations to certain locations and capture daytime and nighttime dynamics." [10]
Where building records are missing, machine learning fills in height, floor count, function and use type [6]. So the estimate is strongest where municipal building data is good and thinnest where it is absent, and the dataset tells you which is which, because ORNL reports how confident it is in each figure [9]. Daniel Adams, the ORNL R&D scientist who led the study, said "This is a really important project for showcasing how AI and decision analysis can really be blended together in a trustworthy manner." [13]
The delivered number is still an average. Mosaic publishes an ambient population, the mean count at a location over 24 hours, with movement between homes and workplaces folded into that mean [8]. Zimmer's framing is daytime and nighttime dynamics, and ORNL says the temporal specificity is better than LandScan Global's [9]. ORNL has not published Mosaic's spatial resolution, or how the day and night components reach a user [20]. A dispatch tool needs that answered before it promises an hourly count.
Start with whether the recommendation your product makes changes between the daytime figure and the nighttime one. An evacuation notice and a retail catchment score both move; a quarterly territory plan stays put, and ORNL frames the value of the data around fast decisions such as disaster response and infrastructure planning [19]. Then ask whether your interface can carry a range. If the user sees one integer and acts on it, the uncertainty layer is something you paid to compute and then threw away. Showing the band costs a design cycle and lets a planner widen a search radius where the building data is poor.
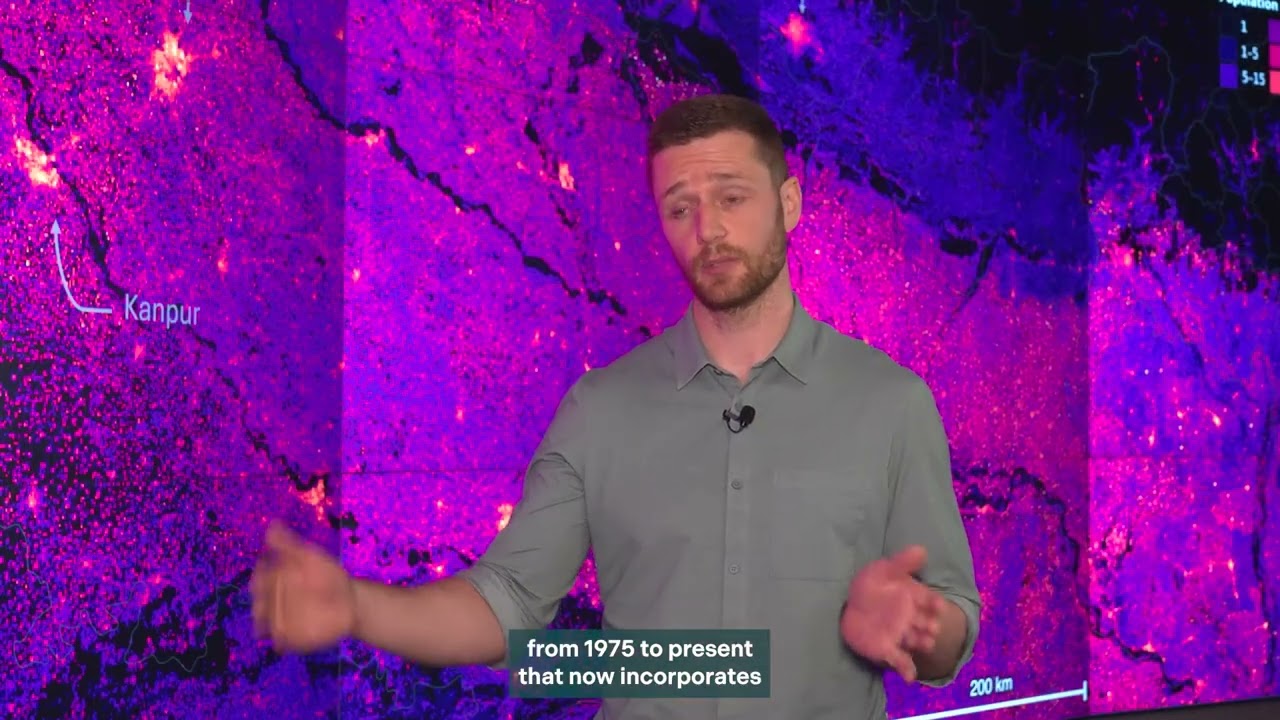
LandScan Mosaic Timeseries, the next release, back-casts annual distributions from 1975 through 2024 with Mosaic as its input [14]. That is 50 annual layers [17]. Zimmer said the five-decade timeline could help examine the growth of cities and settlements before they were already well established [21]. The team is also working to add demographic characteristics to Mosaic [16]. The study is published in Scientific Reports [15].
What to watch
- Publication of Mosaic's spatial resolution, licence and update cadence, all three of which a shipped product needs.
- Whether the LSM-TS back-cast is validated against censuses for the 1975 to 1990 years, where building records are sparsest.
- Whether the promised demographic characteristics arrive as age bands usable for school and clinic siting.