Leadership1 distinct publisher3 min readPublished
American electricity demand is growing more than ten times faster than it did over the prior fifteen years, and for anyone signing a long facility lease the hours needed to restore power now weigh against the megawatts on offer.
The Board Room · Leadership desk

Compiled by The Board RoomSomething wrong?How this is made
Reversing the comparison makes the planning problem legible. If 1.7% a year is more than ten times the pace of the preceding fifteen years [1], the earlier trend ran at roughly 0.17% a year or below [12], which is flat for the purposes of anyone sizing a maintenance budget or a replacement cycle. Compounded, five years at 1.7% is about 8.8% more load riding the same conductors [13]. That is not a large number in isolation, and it is a large number if the staffing plans and spares inventories underneath it were written for a system nobody expected to grow.
At the system level, 8.8% over five years is small next to the swings utilities absorb from weather every year. The load, though, does not arrive at the system level. The projection that data center demand nearly triples by 2030 implies, if its baseline is roughly the present, about 25% compound annual growth in a single class of customer [14], and that customer connects at a named substation rather than across a state.
Restoration speed separates from available megawatts because the two answers come from different parts of a utility. Capacity is a planning and interconnection question, settled years ahead in studies and queue positions. Restoration is a question of crews, spares and physical access, settled on the day. The contributor's argument is that reactive maintenance was tolerable while demand stayed flat and no longer is [8], and that the mismatch already shows up as conductor sag and overheated transformers under today's loads [16].
The evidence deserves two caveats. The piece is a contributor column, and Entrepreneur states the opinions are the contributor's own [11]; its load-bearing demand figure is attributed to federal energy forecasts without naming the forecast or the agency [1]. Its remedy section argues for specialized high-voltage line repair gear, including insulated aerial platforms and modular rigs said to cut repair windows from days to hours by avoiding full feeder de-energization [5]. The direction of the demand claim is credible, and the days-to-hours figure is the shape of claim a supplier makes, which this record does not let us test.
Sequencing is what should govern behaviour this quarter. New transmission into terrain utilities have rarely serviced, which is what remote wind and solar sites require [9], is a decade-scale build, and no site chosen in the next ninety days will benefit from it. What a tenant can still buy is written into the lease and the interconnection agreement, or installed on the property, and both are priced against the network as it stands. The trade is between paying for that hedge during site selection and learning its price on the day the substation serving you fails.
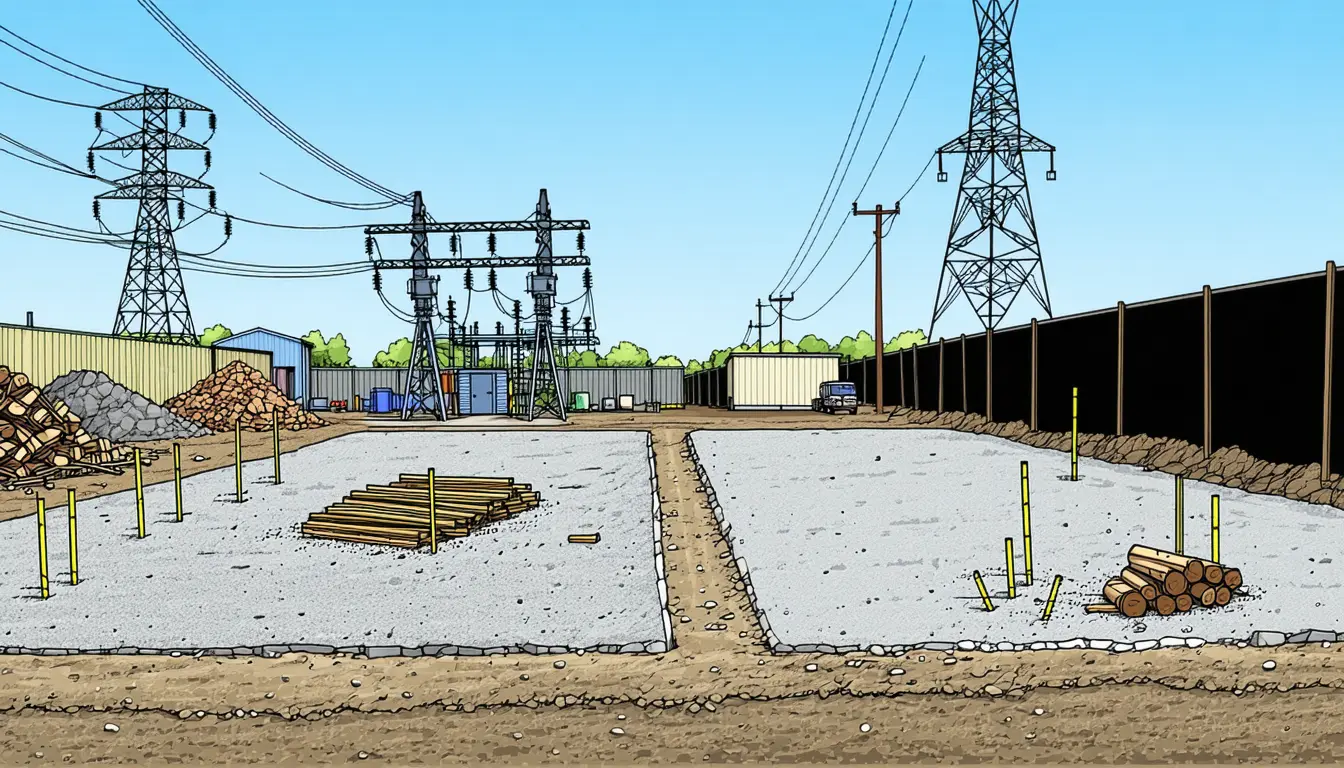
Ranked by verification strength, evidence, and original report placement.
The piece advises that businesses planning new facilities or expanding operations should consider not only how much power a location can provide, but also how quickly that power can be restored when infrastructure fails.
The article is an Entrepreneur contributor piece, and the publisher states that opinions expressed by Entrepreneur contributors are their own.
The piece recommends judging locations by restoration speed but names no metric, data source or benchmark for comparing restoration speed across candidate sites.
If 1.7% a year is more than ten times the prior fifteen-year pace, that earlier pace ran at roughly 0.17% a year or below.
Five consecutive years of 1.7% growth compounds to about 8.8% cumulative load growth.
Between 2020 and 2025, U.S. electricity demand grew roughly 1.7% a year, more than ten times the annual pace utilities saw over the prior decade and a half, according to federal energy forecasts cited in the piece; the piece does not name the specific forecast or agency.
Distinct publishers with included, body-backed reporting in this cluster.
1 article · August 27, 2026
Follow any of these and your For You feed starts watching them — no settings page required.
invest
Behind-the-meter gas is the data center buildout's real cost: 318 Mt a year1 distinct publisher
product
Apollo Atomics bets nuclear's cost problem is the steam generator, not the reactor2 distinct publishers
invest
Nvidia halves the Ohio backstop while the megawatts stay the same1 distinct publisher
leadership
The coherence bill: growth doesn't break the story at once, it un-anchors every decision1 distinct publisher
Evidence-backed comparisons of source perspectives and observed adoption signals. Read the methodology
Which Builder, Operator, and Investor concerns the observed source mix emphasized—not a truth score.
Evidence, demonstrated adoption, hype gap, incentives, and confidence are assessed independently, each on its own current evidence. How these are measured.
One column, no named sources
Every figure in this story comes from the same Entrepreneur contributor piece, and the piece sources almost none of them. The growth rate points to unnamed federal forecasts; the six-figure outage cost, the days-long distribution center shutdown, the days-to-hours repair window and the 2030 data center projection arrive with no study, filing, utility or forecaster behind them. What is solidly established is narrow: the publisher's own contributor disclosure, and the fact that the restoration-speed advice is offered without any metric to apply it.
Nothing countable
The piece says utilities "increasingly rely" on purpose-built line repair gear and that crews "report real gains," but names no utility, no fleet, no procurement, no pilot and no date. There is no deployment, release or disclosure here to count, and we will not manufacture one from adverbs.
Confident numbers, absent anchors
The gap is not in the thesis, which is reasonable, but in the precision. "Days to hours," "six figures," "nearly triple by 2030," "a pace not seen in decades" — each reads as measured and none is measured. The dek's promise that restoration hours now weigh against megawatts is stated as a market shift already underway, while the reporting supplies no way to weigh them. The unanchored 2030 baseline is the clearest case: the same sentence supports a mild ramp or 25% annual growth.
Advice that ends at a product category
Read the technology section in order: a problem framed as urgent, an improvement quantified without a source, then a recommendation that utility operators buy "specialized electric line repair equipment built specifically for high-voltage transmission and distribution work." That is the shape of placement, and Entrepreneur's only guard against reading it that way is the boilerplate line that contributors' opinions are their own — a disclosure about viewpoint, not about who benefits commercially.
Clear provenance, no corroboration
We are confident about what this story says and where it came from: one full contributor column, read end to end, with its disclosure in plain sight. We have no basis to judge whether its numbers are right. That combination — unambiguous provenance, zero triangulation — is what holds this in the middle rather than higher or lower.