Build1 publisher2 min readPublished
Oizom's Go heatmap service spent 80% of each render encoding PNGs
Oizom replaced an hourly Python heatmap job with an on-demand Go service that renders 20 air-quality images in 30 ms. Per-function timing then traced 80% of each render to PNG encoding, on test images small enough to keep the interpolation cheap.
The Engineer · Build desk
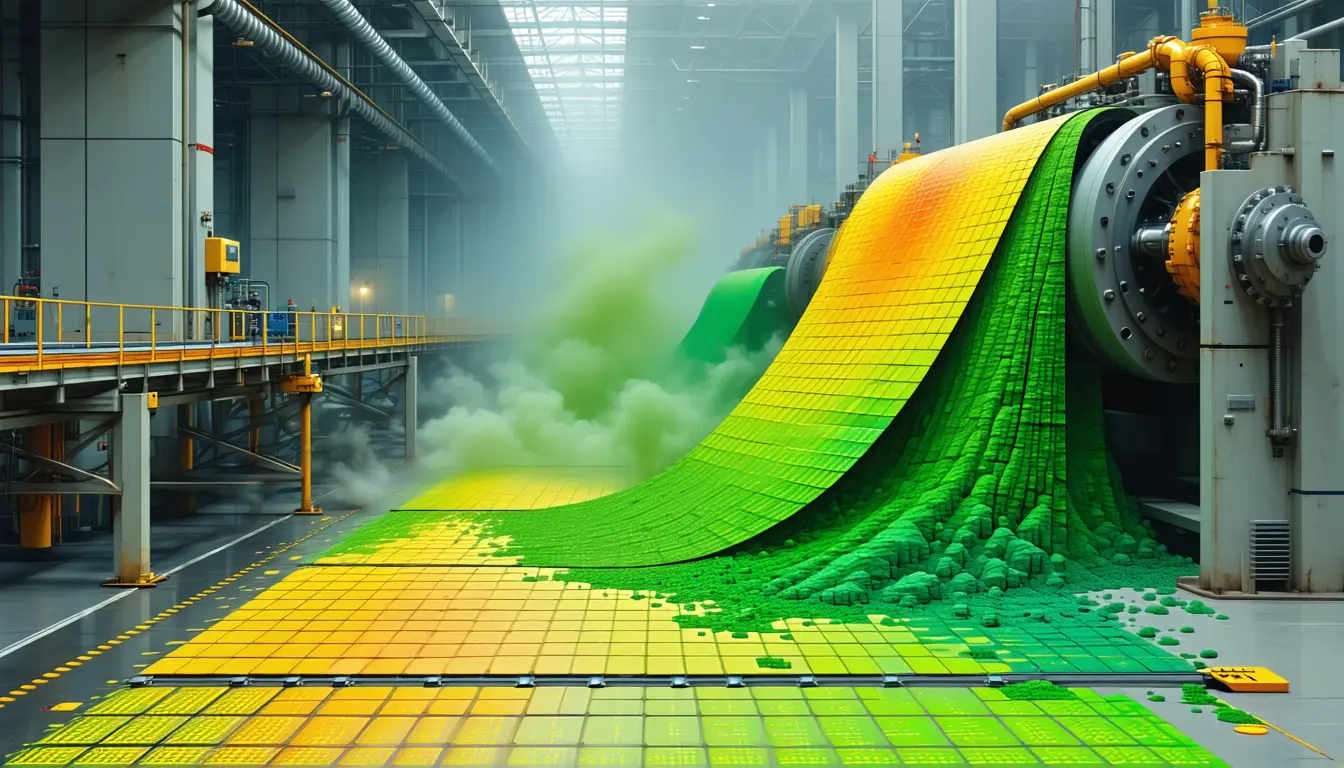
What happened
- The old pipeline pre-computed a 1km grid for each config every hour and stored each result as a Base64 PNG in a time-series database.
- That Python job used 4 GB of RAM, 2 CPUs and one or two instances, and still fell short while serving only 3 heatmap configs.
- After a weekend browser prototype worked, the team still put rendering on a server, because the frontend runs on old phones, corporate laptops and TVs.
- Oizom replaced PNG output with JPEG and, because JPEG has no alpha channel, now masks each image down to its required area in the browser.
Compiled by The EngineerSomething wrong?How this is made
Why it matters
- decision A team with a slow scheduled image job has reason to time its encoder on its own before changing languages, the step Oizom took before it found the PNG cost.
- cost Transparency work now lands on clients: the old phones, laptops and TVs that ruled out browser rendering run a JavaScript mask the author puts at 10 to 30 ms.
- contradiction The post puts the Python baseline at about 5 seconds per image in its opening and at 10 to 20 seconds further down, so the before-and-after gap depends on which figure is right.
Profiling came last, as it usually does. The team had already moved rendering to a Node proxy and then to Go, which it chose because it was faster, throttled less and stayed readable for other developers [11]. "Something still felt off; it shouldn't take this long," wrote the author, who leads Oizom's software team [12][1]. Time logs on each function found the cause [13].
The logs pointed at Base64 PNG encoding, at 1 to 3 ms per image and 80% of the render [13]. Working back from those figures, a whole render took 1.25 to 3.75 ms. Everything else, IDW with wind included, took 0.25 to 0.75 ms [2][3]. The measured step bundles the Base64 wrapping with the PNG compression, and the post does not split the two [13].
At 20 images in 30 ms, the headline rate is 1.5 ms per image [1]. That sits inside the pre-JPEG range. The author wrote only that switching to JPEG "boosted performance dramatically" [14], so the 30 ms could have come from either encoder.
Workload decides how render time divides between encoding and math. The one load test described used 100px images and 10 known points, with 40 images per request [10]. Each grid cell's value is computed from the known devices' readings [4]. Interpolation work therefore grows with sensor count, while encoding work follows pixel count alone. At 10 sensors the math is small. I'd expect a config with hundreds of devices to move the balance back toward interpolation.
Small images are the decision I'd copy. Rendering at 100px keeps both the interpolation and the encoder cheap. The author found that with gradient colors, 150px and 1000px differed little beyond sharper edges [9].
Oizom's 80% figure comes from the Go service [13]. The Python job it replaced also applied its wind effects incorrectly [6], so its slow renders may have had other causes.
For a gradient heatmap at 100px, I'd take the same JPEG trade. I would have tried a cheaper PNG compression setting first. Keeping the alpha channel would have kept masking on the server, away from the weak clients the frontend has to support [8][15].
What to watch
- Oizom publishing render timings at production sensor counts, well above the 10 known points in its described test.
- Measured masking times on the old phones and TVs that Envizom's frontend serves.
- A before-and-after split of the Go service's timings around the JPEG switch.