Published Invest3 min read
Ten basis points of CPI relief bought the KOSPI 4.4% in a single session
July US inflation slowed to 3.4% year-on-year from 3.5%, and Asian equities repriced hard. The size of the move says more about positioning than about inflation.
Context for builders, not their beat.See today for builders
What happened
- July US Consumer Price Index came in at 0.1% month-on-month, exactly matching analyst forecasts.
- The year-on-year US inflation rate dipped to 3.4% from June's 3.5%.
- The MSCI Asia-Pacific ex-Japan index climbed 0.97% on August 13.
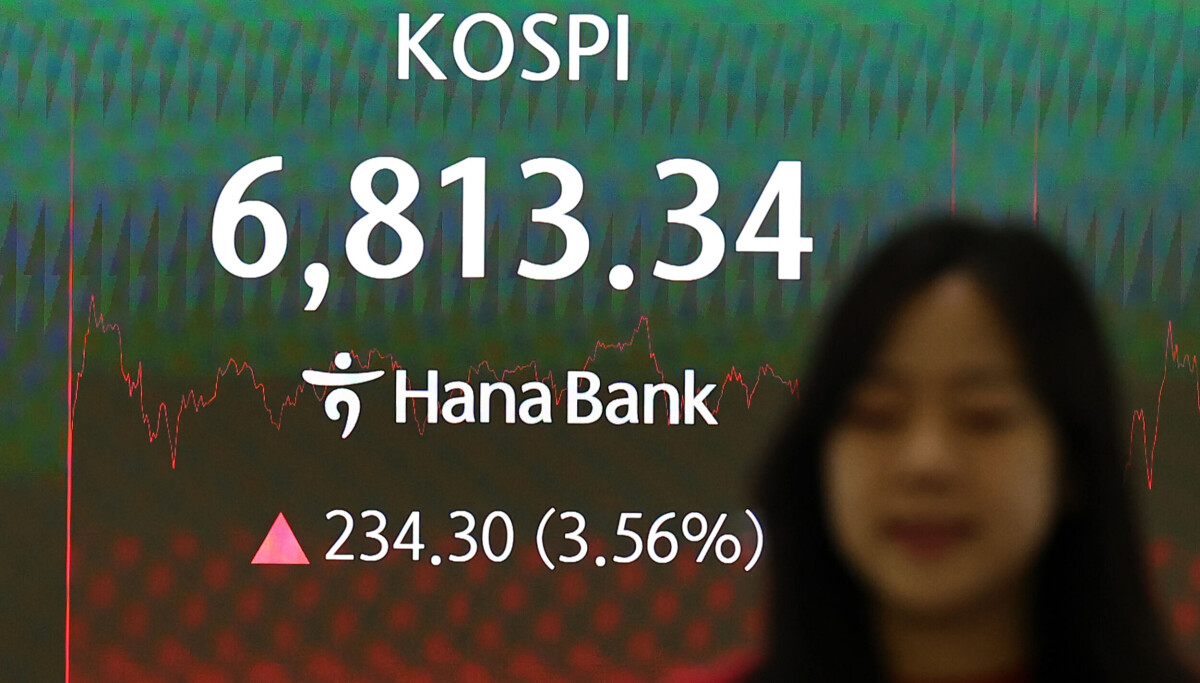
- South Korea's KOSPI surged 4.4% in a single day.
- Japan's Nikkei 225 added 1.86%.
Compiled by The InvestorSomething wrong?How this is made
Why it matters
July's US Consumer Price Index printed 0.1% month-on-month, exactly matching analyst forecasts, with the annual rate easing to 3.4% from June's 3.5% [1][2]. On August 13 the MSCI Asia-Pacific ex-Japan index rose 0.97%, Japan's Nikkei 225 added 1.86%, and South Korea's KOSPI rose 4.4% [3][5][4].
That is a ten basis point deceleration in a year-on-year rate [2], on a number that came in as expected, producing a single-day move in Seoul roughly 4.5 times the regional benchmark and 2.4 times the Nikkei [1][9]. Nothing in the print concerned Korean earnings, Korean exports, or Korean policy. The mechanism was entirely rate expectations: per the CME FedWatch tool as reported by Cryptobriefing, the implied probability of a September Fed hike fell to around 40% from 54% the previous week [6]. That is 14 percentage points, or a quarter of the previously priced risk removed [3]. Divide the KOSPI move by the repricing and you get roughly 0.31% of index gain per percentage point of hike probability withdrawn [4]. Positioning with that kind of sensitivity to a single macro series is a leveraged bet on one outcome, whatever the fund fact sheets say.
The uncomfortable part is that the market's own read on that outcome is not agreed. The same publisher's coverage of the emerging-market rally cites prediction-market pricing for a September 2026 hike at 28% YES, down from 31% twenty-four hours earlier, with October at 39.5% [7][8]. Its gold coverage puts the September probability at roughly 34%, down from about 55% earlier [9]. And its description of the inflation data itself differs: a 0.4% monthly decrease with the annual rate at 3.5% and core flat [10]. Between the 40% and the 28% figures there is a 12 point gap on the same question in the same window [5]. Anyone sizing risk off a headline probability should know which one they are quoting.
Two other details cut against the clean pause narrative. October hike pricing sits above September pricing by 11.5 points on the prediction-market numbers [6], which is the market pricing delay rather than cancellation. And US 10-year yields were around 4.69% in mid-August 2026 [11], with oil holding between $80 and $88 a barrel on geopolitical tensions, high enough to keep upward pressure on headline inflation globally [12]. The August 13 rally also followed a July 3 surge driven by weak US jobs data [13], meaning two of the region's better sessions were imported from US macro prints.
Gold is the cross-check, and it is not confirming. Spot briefly touched $4,500 intraday and posted a two-month high of $4,449 before retreating toward $4,300, closing near $4,350 by mid-August [14][15]. A flat July Producer Price Index gave traders reason to pare positions [18]. That $200 band is about 4.6% of the closing level [8], which is a market with no conviction rather than one celebrating a pause. Gold is up roughly 25% over twelve months but still about 23% below its January 2026 record near $5,600 [16][17].
Watch the August CPI release, which lands before the September FOMC [19], and watch whether the same sensitivity works in reverse: a hot print should cost the KOSPI on the same beta it just earned. Watch Powell and the FOMC for language changes on the hike option [20]. And watch whether October pricing converges down toward September's, or September's drifts up to meet it.
Claim ledger
Ranked by verification strength, evidence, and original report placement.
- [1]
July US Consumer Price Index came in at 0.1% month-on-month, exactly matching analyst forecasts.
ReportedView cited source - [6]
The CME FedWatch tool showed the likelihood of a September rate hike dropping to around 40% from 54% the previous week.
Sources & coverage · 1 publisher
The reporting this story was synthesized from, earliest first. Every link goes to the original.
- cryptobriefing.comEditorial TeamAug 13Gold retreats toward $4,300 as traders weigh Fed rate-hike path
- cryptobriefing.comEditorial TeamAug 13Asian stocks poised for weekly gain as US rate hike bets fade
- cryptobriefing.comEstefano GomezAug 14Emerging-market assets rally as US inflation data suggests Fed rate hike delay