Build1 publisher3 min readPublished
Arena's CEO defines the leaderboard score as utility to Arena's own visitors
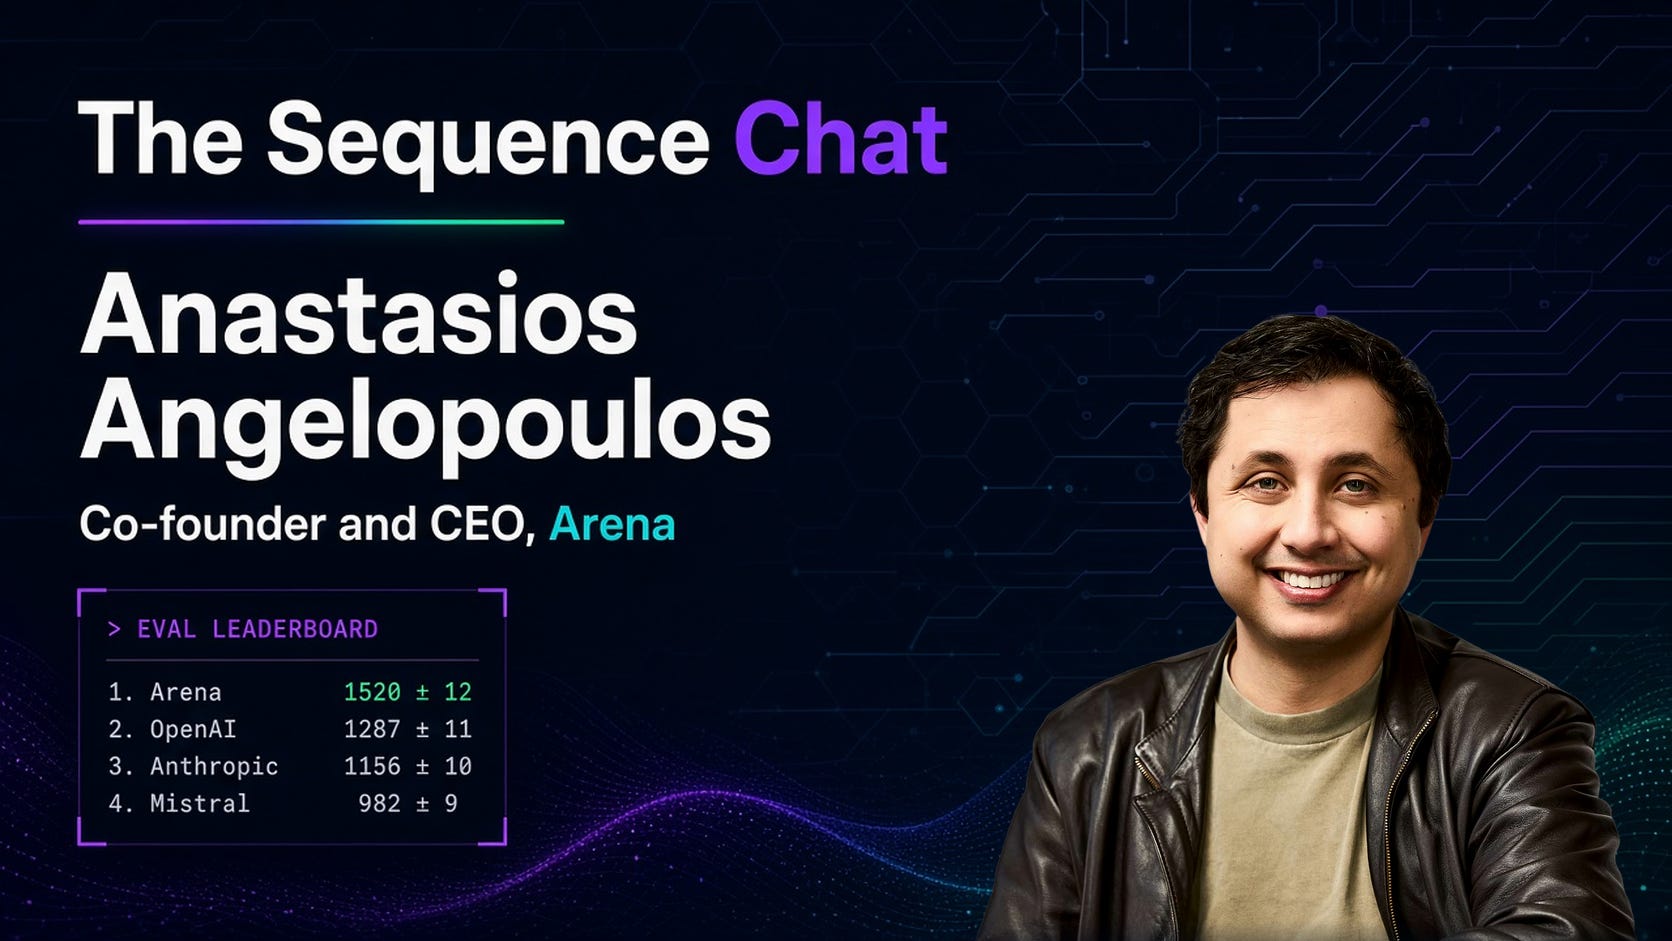
Anastasios Angelopoulos says the number ranks how useful a model is to the tens of millions of people who visit Arena, so it travels to your stack only if your users and your task mix resemble theirs.
The Engineer · Build desk
What happened
- Arena co-founder and CEO Anastasios Angelopoulos says an Arena score represents the utility of a model to Arena's userbase, which he puts at tens of millions of monthly visitors.
- The platform has moved past pairwise human preference and now also ranks models on task completion rates and hallucination rates.
- The latest Agent Arena release adds task categories, cost per task and a performance-cost frontier, which he prefers to price per token because token consumption per task differs between models.
Compiled by The EngineerSomething wrong?How this is made
Why it matters
- constraint A score defined over Arena's own visitors travels only as far as the resemblance between their prompts and yours, so the aggregate rank cannot stand in for a workload it never sampled.
- cost Cost per task understates the real bill by one over the completion rate, so the cheaper agent on the published axis can be the more expensive one to get work finished.
- decision A shortlist that falls inside one confidence interval has to be settled on latency, price or tool-schema behavior, because the ordering is not carrying information at that resolution.
- precedent Arena treats labs optimizing toward its leaderboard as aligned with real user utility, which leaves the work of telling a tuned model from a better one with whoever is reading the board.
The definition does the work here. An Arena score is the utility of a model to Arena's userbase, and that userbase is tens of millions of monthly visitors [2]. It is a measurement over a population and over the prompts that population brings. Two conditions have to hold before it predicts anything about your deployment: your users have to want what Arena's users want, and your task mix has to resemble the mix the leaderboard aggregates over.
Randomized assignment covers the first half of the fairness problem and not the second. Angelopoulos says every model gets tasks of the same difficulty on average, which is what keeps model-to-model comparison honest [11]. Equalizing difficulty across models does nothing to make the leaderboard's distribution of tasks look like yours. That is what the task categories in the latest Agent Arena release are for [9], and a category you can match beats an aggregate you cannot.
Cost per task is the better denominator, for the reason he gives: token consumption per task varies between models, so price per token prices the wrong thing [10]. The gap is completion. Arena also ranks task completion rates [5], and cost per successful task is cost per task divided by that rate [14]. A model that finishes half its tasks costs twice its per-task figure for each task it actually finishes; at 90 percent completion the markup is about 1.11x [14]. So two agents can sit on the same point of a cost-per-task axis and differ by nearly a factor of two on the invoice. The question put to him was about cost per successful task, and the answer describes cost per task [13].
The most immediately useful line in the interview is the statistical one: under standard assumptions, overlapping confidence intervals mean two models are indistinguishable on the available data [6]. If your shortlist sits inside one interval, the ordering is not a tiebreaker, and the tiebreak has to come from something you can measure in your own harness.
Preference was the original instrument because a benchmark table could not see a difference two minutes of chatting could. Vicuna and its competitors scored similarly, chatting made the gap obvious, and Battle Mode followed [4]. The whole thing began as a Berkeley SkyLab side project built to show the Berkeley model beat a Stanford one [3]. That origin as an argument-winning tool is a fact about where the leaderboard came from, not a mark against it. The move since then, into completion and hallucination rates [5], is a move back toward outcomes you can count.
The Goodhart question gets a different kind of answer. Asked how to separate a genuinely better model from one tuned to Arena's prompts, voting behavior or style, Angelopoulos says Arena is happy when labs climb the leaderboard, because climbing it means models more useful to millions of Arena users [12]. As incentive design for a platform, that is coherent, but it is not a detection method: it does not establish that a score improved on Arena's traffic improves anything on traffic Arena never sampled. He also says there is no universal method for ranking models [7], which is the same limit stated from the other side.
The interview does not show Arena's own team conceding that leaderboard readers misread the number, but it does show something narrower and more usable: style and verbosity are controlled for, factuality is carried as a separate signal [8], and the population the score is defined over is stated openly [2]. The step from that number to your workload is arithmetic you have to do yourself.
What to watch
- Whether Agent Arena publishes a cost-per-successful-task axis next to its cost-per-task figure.
- Whether Arena releases per-category scores and intervals, so a buyer can read the category matching their workload instead of the aggregate.
- Whether Arena ever publishes a method for detecting models tuned to its prompts and voting behavior, rather than treating lab optimization as aligned by construction.