Science1 publisher3 min readPublished
Water table depth governs how hard warming pushes peatland CO2 emissions
The largest dataset yet of northern peatland CO2 budgets ties the temperature response of emissions to water table depth. Its authors argue that rewetting gets more valuable as warming continues.
The Scientist · Science desk
What happened
- A team led by the University of Munster assembled the largest international dataset on CO2 budgets of northern peatlands and reported the analysis in Nature Communications.
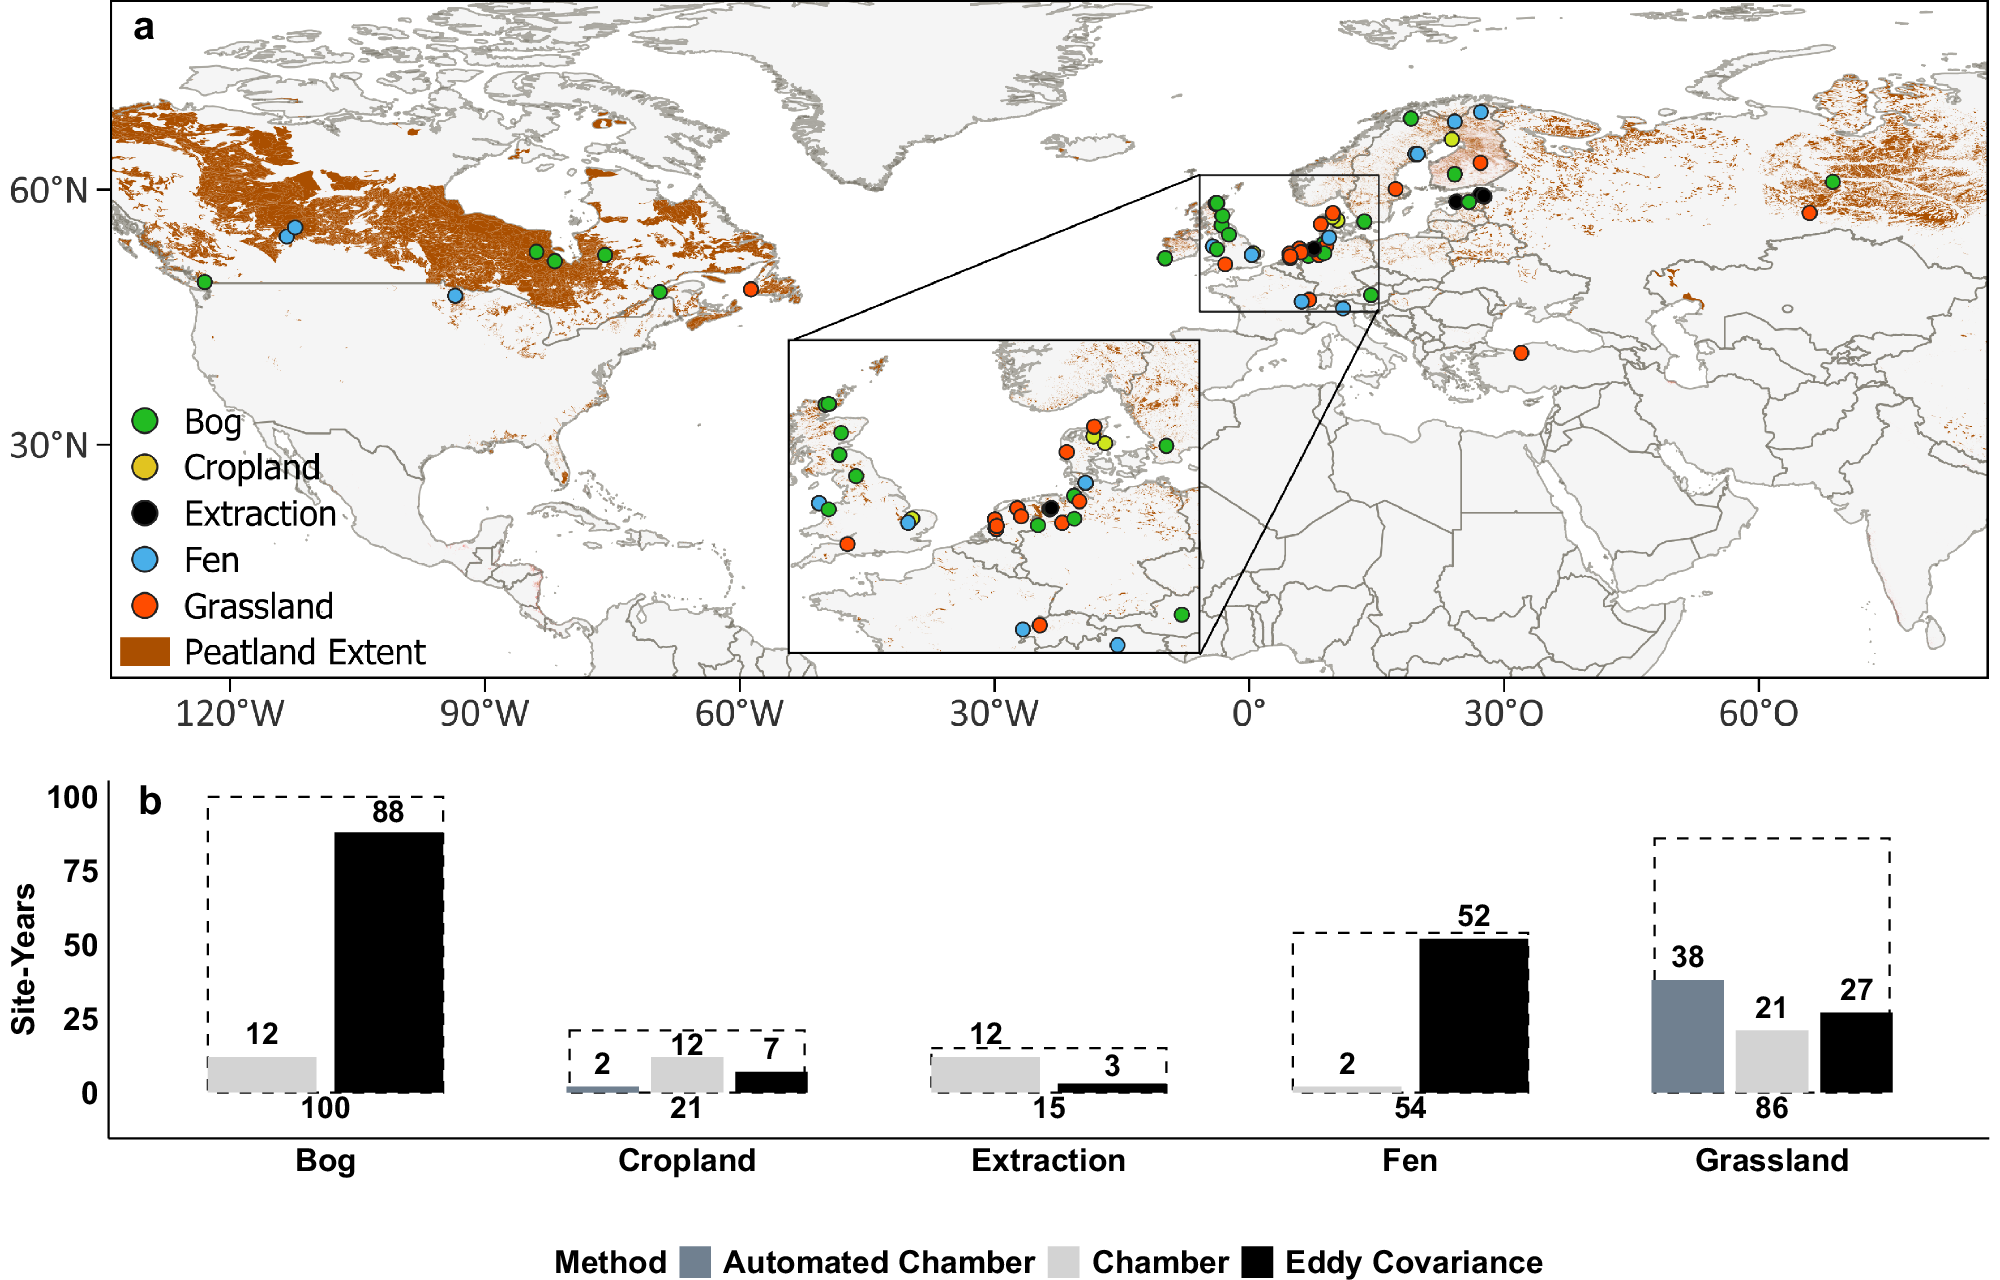
- The annual analysis covers 276 site-years from 114 temperate and boreal peatlands, including sites in Germany, Estonia, France, the United Kingdom and North America.
- The lower the water table, the more strongly a peatland's CO2 emissions respond to rising temperatures, and a higher water table dampens that response.
- A separate set of 113 site-years of daily CO2 flux measurements reproduced the same interaction at day-to-day timescales.
Compiled by The ScientistSomething wrong?How this is made
Why it matters
- decision A restoration plan that settles on a target water table is also settling how strongly the site's emissions will answer to future warming, not only what it emits now.
- cost Leaving a deep-drained peat site as it is gets more expensive in emissions terms as temperatures rise, and that growing penalty falls on whoever controls the drainage.
- precedent If sensitivity tracks depth this closely, reporting a site as drained or rewetted stops being informative and centimetres below the surface becomes the quantity worth monitoring.
The two variables cannot be read separately because of oxygen. Peat accumulates in the first place because waterlogging keeps decomposition slow [18]; drainage lets air into the profile, and microorganisms then break the organic material down faster, releasing CO2 [14]. The measured pattern is what that chemistry would predict: in the annual budgets, emissions rise considerably more with temperature where the water table sits deep [8]. The sensitivity in question is the response of one site's own CO2 balance to temperature, not a global quantity.
How much of this transfers to a project depends on design. The paper, published in Nature Communications [1], rests on 276 site-years spread over 114 peatlands, which averages about 2.4 years per site [15], so the annual analysis leans on contrasts between sites rather than long records at any one of them. The sites are not matched: natural fens and bogs sit in the same dataset as croplands, grasslands and former peat extraction areas [4], and the team used explainable machine learning because vegetation and solar radiation also move the fluxes and the relationships are nonlinear [5]. A gradient in water table depth across many sites is still not the same measurement as raising the water table at one site and watching what follows.
That is why the second dataset carries more weight than its size suggests. Its 113 site-years of daily fluxes [9] amount to about 41 percent as many site-years as the annual set [16], but daily data let temperature vary while land use and plant community hold still, so the temperature response is estimated against a nearly fixed background. Nicolas Behrens of the University of Münster, the paper's first author, says it is the first demonstration across many peatland sites that higher water tables reduce the effect of high temperatures on CO2 emissions [10]. Two datasets at different time scales pointing the same way is a firmer result than either alone.
The depth numbers turn out to be messier than they first appear. Emissions fall off sharply once a very low water table is brought to within 60 to 75 centimetres of the surface [6], while the range the study identifies for minimising emissions is 20 centimetres or shallower [7]. Moving from the first to the second is a further 40 to 55 centimetres of rise [17], and on the cropland and grassland sites in this dataset [4] that is the increment that competes with the land use itself.
This paper stops short of telling you what a rewetting project is worth. The analysis covers CO2 alone, and the authors note that a complete climate balance needs methane and nitrous oxide, whose emissions can also change as a result of rewetting [12]. Nothing in the published account addresses crediting, offsets or national inventories [19]. Water table depth is the variable a restoration plan can name and defend from this evidence; this paper does not contain a figure for tonnes of CO2-equivalent avoided at a given target depth.
What to watch
- Whether follow-up work measures methane and nitrous oxide at the same sites, which is what a net greenhouse balance would need.
- Whether before-and-after records from actual rewetting projects reproduce the cross-site water table gradient seen here.
- Whether inventory and restoration methodologies begin requiring reported water table depth rather than a drained-or-rewetted category.