Build1 distinct publisher2 min readPublished
Google Research argues the weeks in geospatial modelling go into curation rather than modelling, and that an agent can absorb them. The engineering worth copying is that the orchestrating model plans over pointers and never reads the data.
The Engineer · Build desk

Compiled by The EngineerSomething wrong?How this is made
A planner that never sees a row cannot catch what you catch by scrolling rows. That is the trade inside the handle design [3]. Context length now bounds the length of the plan rather than the size of the dataset, and in exchange every sanity check has to exist as a tool that returns a summary. A wrong projection, a county code that changed between vintages, a sensor that went to nodata over one province: none of those announce themselves to an orchestrator holding an opaque pointer. Google's own framing concedes how specialised that work is, because it lists spatial validation alongside curation and feature engineering as the weeks specialist teams burn [1]. Whether the tool layer covers that validation is what the whole results table rests on.
Take the CDC figures on their own terms. R-squared is a variance ratio, so the useful reading of 76.8% against 60.0% [6] is the residual: unexplained variance falls from 40.0% to 23.2%, a 42% cut [3]. That is a real gain against people who do this for a living. The FEMA and Social Vulnerability Index margins are thinner, 4.9 and 7.6 points [4], and both of those comparisons are labelled only as a baseline while the CDC one names a manual expert pipeline [7][8][6].
For any of it to move to your geography, spatial autocorrelation has to have been handled the way a geostatistician would handle it. Neighbouring counties resemble each other, so a random k-fold split leaks training signal into the test fold and inflates R-squared for the agent and the human pipeline alike. The number transfers if the folds were spatially blocked, if held-out units sit far enough from training units to break that correlation, and if your target varies at roughly county scale. Those are the conditions, and the fold scheme is the first thing to ask for.
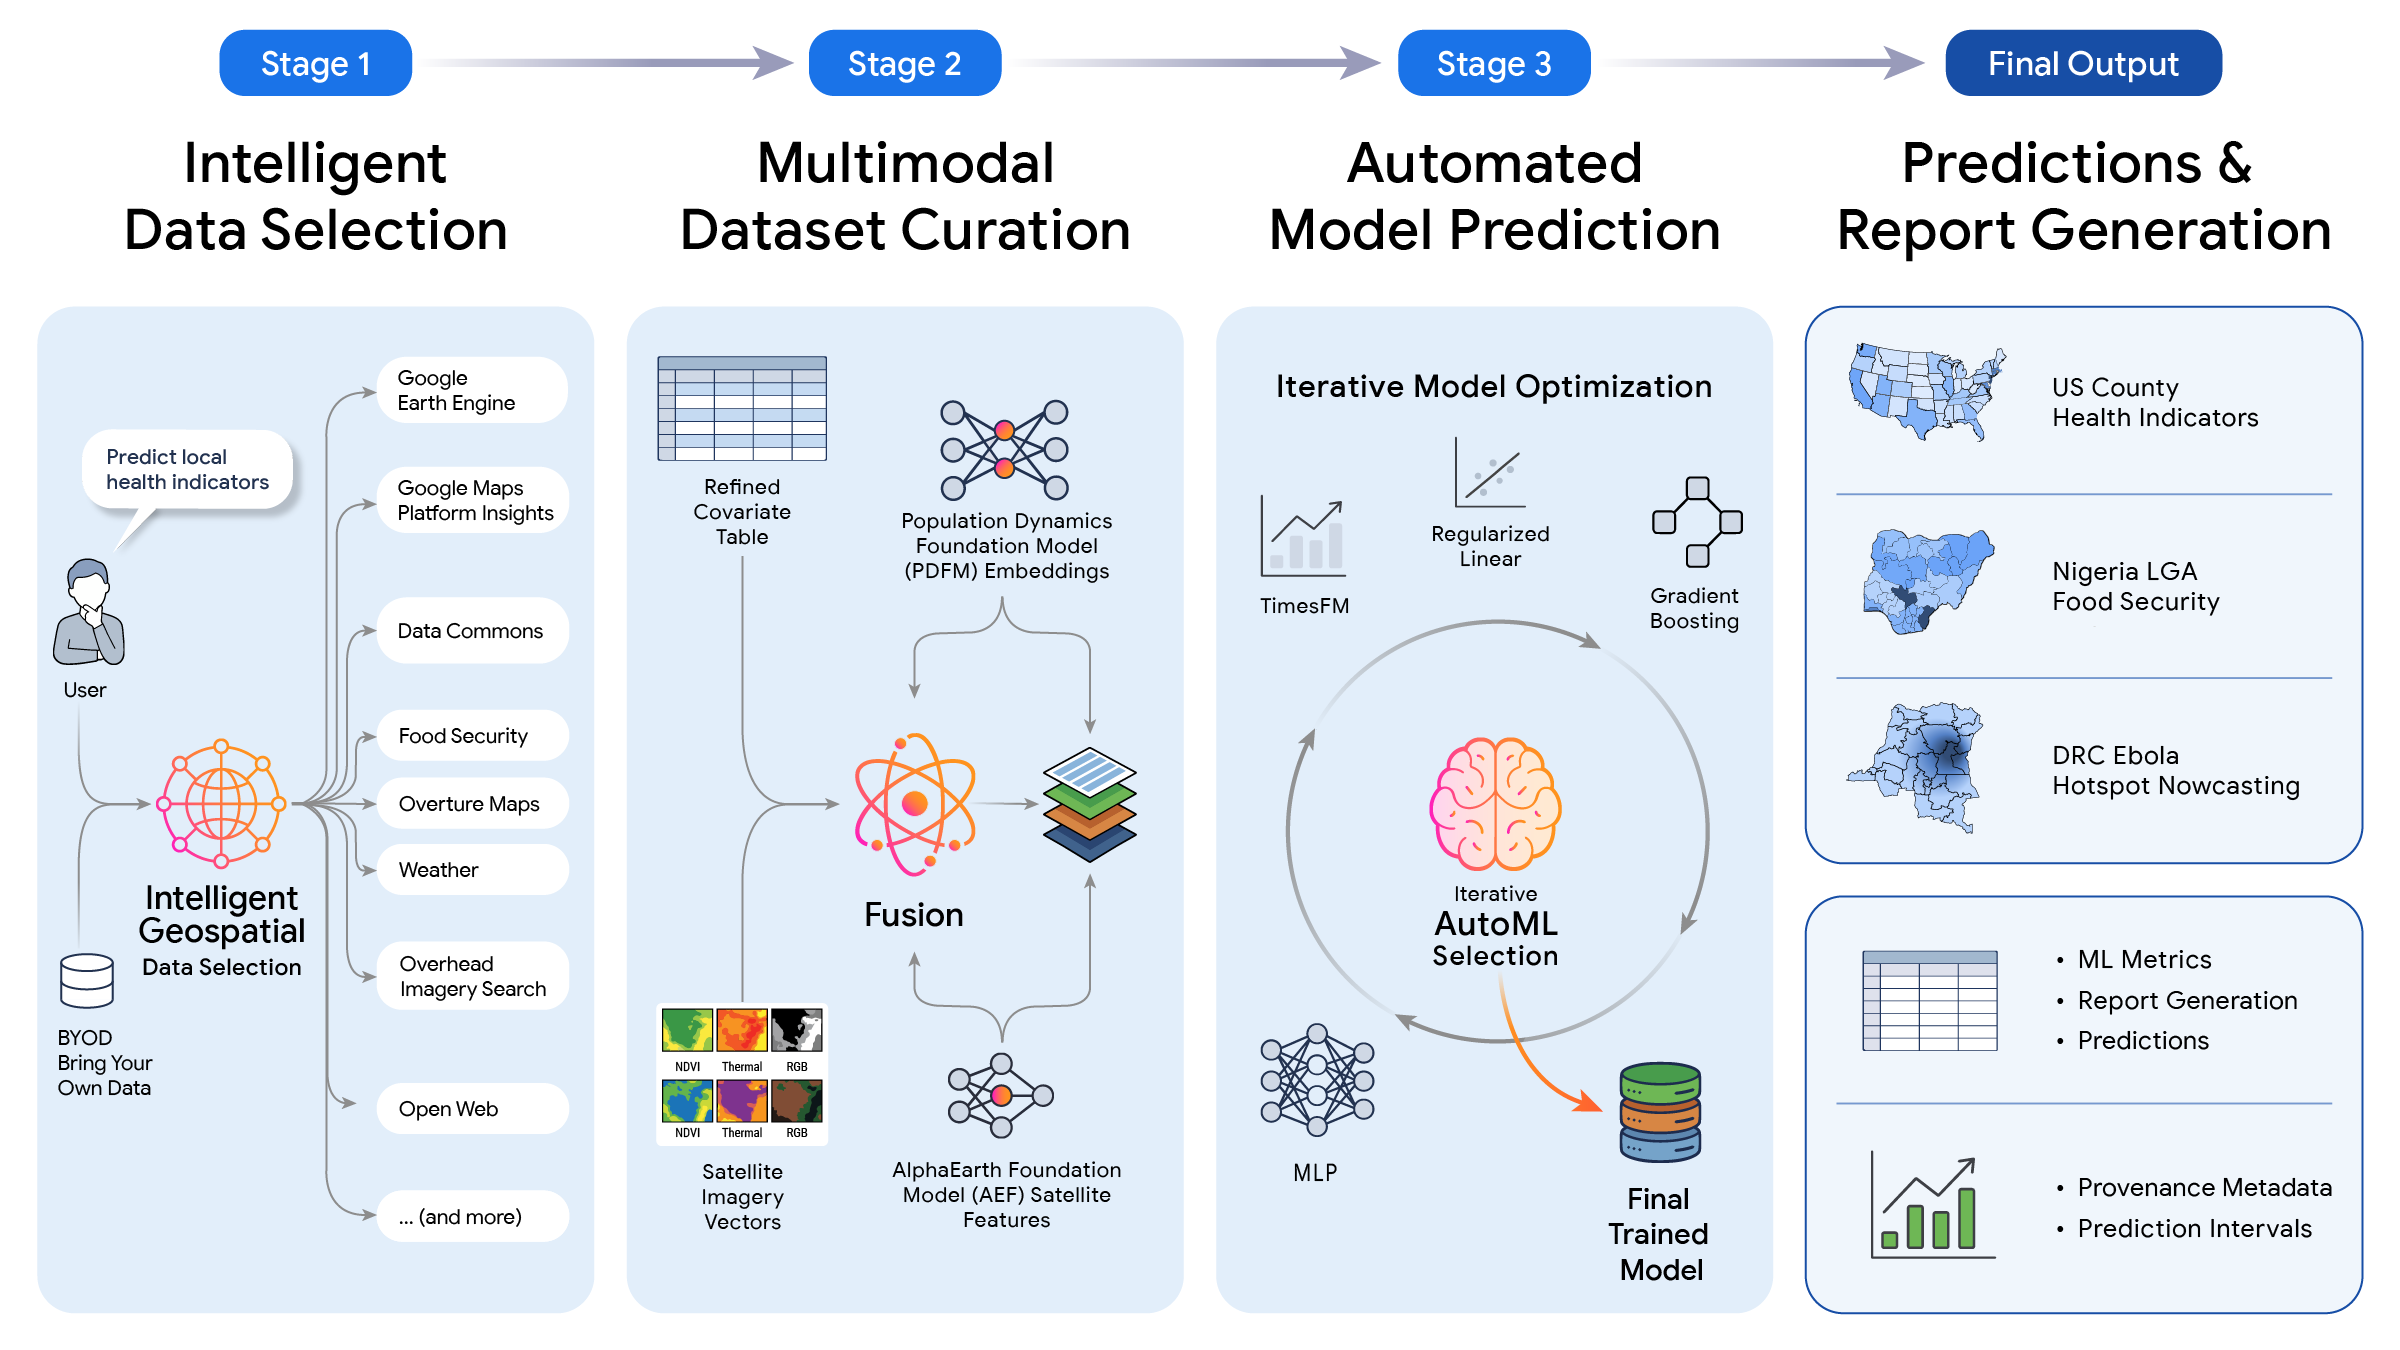
The food security jump interests me most, because it is the case where a human team would have run out of obvious features to try, and the agent's picks were localized market shocks, food price anomalies and microclimate indicators [9]. The stated mechanism throughout is fusion: explicit statistical covariates plus Population Dynamics and AlphaEarth Foundations embeddings, with neither modality sufficient alone [13]. That is the least surprising sentence in the post, which is meant as a compliment.
Google calls the engine an experimental research capability [4], so adoption cost is not a question anyone outside can answer yet. The figure I would want next is the per-indicator spread behind that mean of 21 targets [6], because a mean can be carried by five easy ones.
Ranked by verification strength, evidence, and original report placement.
Across 21 CDC health indicators, the engine achieves a mean R-squared of 76.8% versus 60.0% for a manual expert pipeline.
For predicting FEMA national risk indicators, the engine reports a mean R-squared of 64.9% against a 60.0% baseline.
For the Social Vulnerability Index, the engine reports a mean R-squared of 66.2% against a 58.6% baseline.
By autonomously integrating localized market shocks, food price anomalies and microclimate indicators, the engine doubles baseline accuracy when downscaling food security from the provincial ADM1 level to the local government area ADM2 level, reporting R-squared of 66.1% versus 31.5%.
Google reports that across all experiments the value came from combining structured statistical covariates with latent foundation model embeddings, with neither modality alone capturing the full picture: covariates provide explicit interpretable signals while Population Dynamics Embeddings and AlphaEarth Foundations embeddings encode complex non-linear patterns.
Google Research states that building high-fidelity geospatial models is hindered by a fragmented data ecosystem that requires specialized teams to spend weeks on manual data curation, feature engineering, and specialized spatial validation.
Distinct publishers with included, body-backed reporting in this cluster.
1 article · August 27, 2026
Follow any of these and your For You feed starts watching them — no settings page required.
invest
Google says frontier models already know the facts they get wrong. That is a budget decision.1 distinct publisher
build
Google's wearable biomarker agent is built to distrust its own predictions1 distinct publisher
build
Mobility rhythms beat metadata for place prediction, and the gains are lopsided1 distinct publisher
build
The compiler checks three of the seven things your coding agent had to get right1 distinct publisher
Evidence-backed comparisons of source perspectives and observed adoption signals. Read the methodology
Which Builder, Operator, and Investor concerns the observed source mix emphasized—not a truth score.
Evidence, demonstrated adoption, hype gap, incentives, and confidence are assessed independently, each on its own current evidence. How these are measured.
Quantified but first-party and unreplicable
The source is a primary, bylined first-party research post with specific numbers across five task families (21 CDC indicators, FEMA, SVI, ADM1-to-ADM2 food security, DRC outbreak nowcasting), which is better than a vague capability announcement. But every figure comes from the builder, no linked paper or artifact accompanies it, the comparators ('a manual expert pipeline', '~73% published state-of-the-art Bayesian baseline') are never specified, no error bars or per-indicator tables are given, the referenced ablations are unpublished, and the headline time-savings claim has no timing data at all. Nothing here is independently checkable.
Announcement only
The one adoption-relevant event is the announcement itself. Google describes PPE explicitly as an experimental, early-stage research capability; the supplied source discloses no general availability, API, code or model release, pricing, deployment, or named external user, and the humanitarian and policymaker beneficiaries are described as intended rather than actual. Adoption is therefore measurable only as a first-party release signal at near-zero external uptake.
Framing outruns the reported margins
Positive gap: the rhetoric ('weeks to mere minutes', 'doubles baseline accuracy', 'democratizing geospatial prediction', 'lowers the technical barrier to planetary-scale analytics') is materially larger than what the numbers establish. The FEMA and SVI gains are 4.9 and 7.6 R-squared points against undocumented baselines; the outbreak headline of +10.3 points is about two health zones out of 18 across five weeks; the time-savings claim has no timing evidence; and adoption is an announcement with no access path. The gap is not larger because the CDC result is genuinely substantial (a 42% cut in residual variance) and the architectural claim about passing opaque handles instead of prompt text is concrete and modest rather than inflated.
Sole source is the vendor promoting its own initiative
Every claim in the cluster originates from Google Research's own blog, published by the engineers who built the system, promoting a capability inside Google's broader Earth AI initiative and its proprietary embedding assets (PDFM, AlphaEarth Foundations, with Remote Sensing Foundations teed up as future work). Google selected the tasks, the metrics, and the baselines it beat, and no independent or adversarial publisher appears in the cluster. Incentive to present favorable framing is high; the explicit 'experimental' and 'early-stage' hedging is the only offsetting signal.
Clear primary text, no corroboration
Confidence in what was claimed is high: the source is a dated, bylined primary document whose figures are unambiguous and quotable, so the claim extraction and the derived arithmetic are reliable. Confidence in whether the performance holds is much lower, because there is one publisher, no replication, no linked paper, and undocumented baselines. Net assessment confidence sits moderately above the midpoint.