Product1 publisher3 min readPublished
Five indexes turn one Postgres insert into six physical writes
A TigerData guide measures what one composite index saves a dashboard query, down to the buffer, then argues that indexes get added during incidents and nobody goes back to price what each one charges every insert.
The Product Desk · Product desk
What happened
- TigerData published a guide arguing that a composite index is a decision, because every insert pays for the index while only the queries that use it benefit.
- On a test table of 40 million rows, the dashboard query without the index read 254,781 buffers in 1,583.016 milliseconds and threw away 39,998,667 rows to find the 1,333 that matched.
- The guide calls indexing Phase 1 of an Optimization Treadmill that buys three to six months before write throughput becomes the next ceiling.
Compiled by The Product DeskSomething wrong?How this is made
Why it matters
- decision The index call comes down to two numbers most teams never put side by side: how often the motivating query runs, and how much ingest headroom is left before writes stall.
- constraint An index review tilts toward adding, because EXPLAIN hands over the saving as a buffer count and nothing reports the per-row write cost.
- exposure Indexes added under incident pressure stay on the table, so the write penalty lands on whoever owns ingest capacity months after the person who created the index has moved on.
Someone adds the index at 2 a.m. because the dashboard is timing out. In TigerData's example the query that took 1,583.016 ms comes back in 3.763 ms [10][12]. The incident closes and the index stays. "Indexes get added during incidents and nobody comes back to audit them," the guide says [3].
The read side of that swap is measured down to the buffer. Without the index the plan reads 130,716 shared hits plus 124,065 reads, which is 254,781 buffers, and discards 39,998,667 rows to reach the 1,333 that matched [10][11][1]. With the index it reads 500 hits and 6, and the sort node is gone, because the B-tree already holds each tag's rows in ts DESC order [12][2]. So 254,781 buffers to 506 is a 503-fold reduction, and the two timings are about 421 times apart [13][3][4]. TigerData tells you to trust the buffer counts and not the timings, since buffers hold steady across runs while timings move with whatever happens to be cached [18].
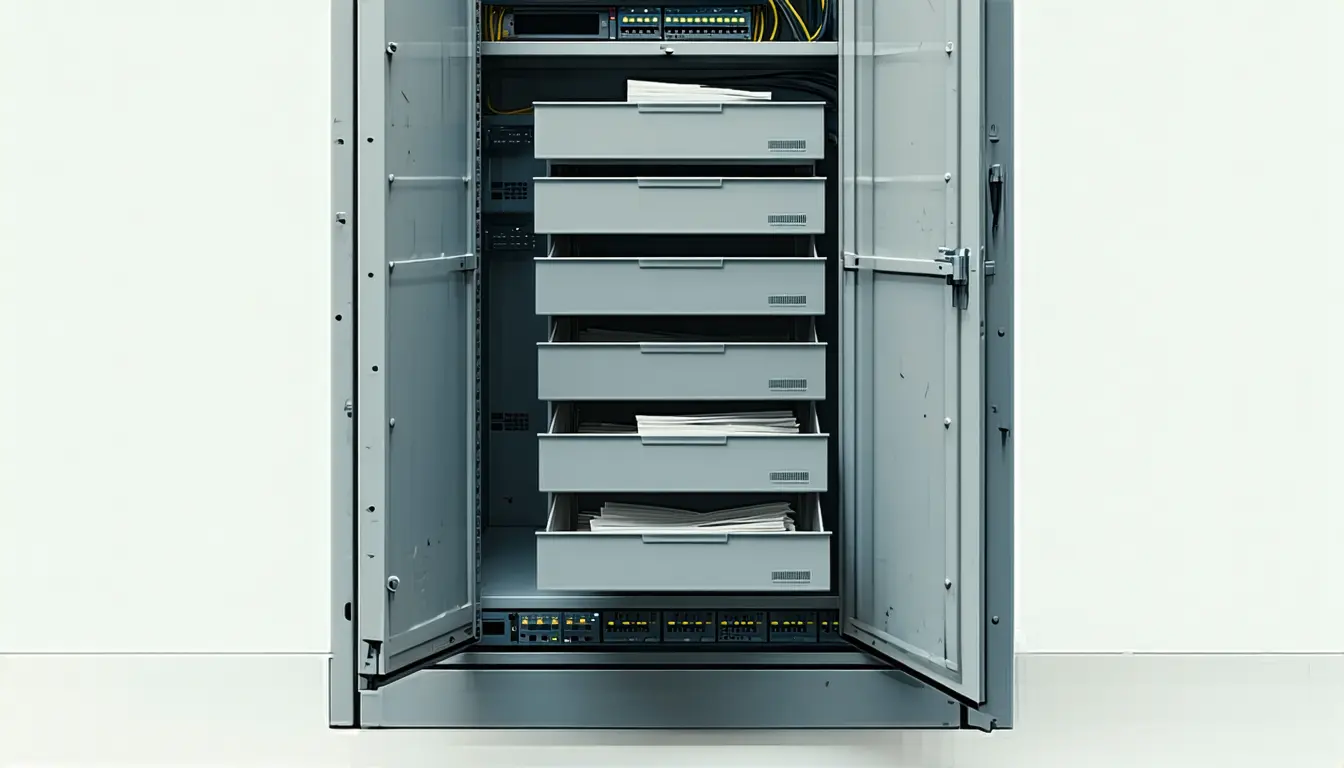
The write side is an assertion. Each index turns one logical insert into an extra physical write with its own buffer to dirty and its own WAL record, so five indexes mean six writes per row [4]. That is 500 percent more physical writes per row than the same table with no indexes at all [5]. EXPLAIN puts a number on what the index saves. It does not report what the index costs per row [6]. "The benefit comes as a number, the cost comes as a hunch, and the hunch loses every time," the post says [7].
Teams tell themselves the index serves the dashboard. In practice the planner uses it more narrowly. A composite index only answers questions that begin with its leading column, since the sort is lexicographic and no ts ordering spans tags [14]. Ask for one hour across all 10,000 tags, 18,500 rows out of 40 million, and Postgres picks readings_tag_ts_idx anyway and reads 161,347 buffers against roughly 254,000 for the full scan [15]. It does 64 percent of a table scan's work to fetch about 0.05 percent of the rows [6][7]. Widen the window to a day and the planner drops the index [15].
These figures come from a vendor's guide, on a table built for the demonstration. 40 million rows across 10,000 tags is 4,000 rows per tag over 90 days, and the 30-day query returned 1,333 of them, almost exactly a third, so the test tags are evenly loaded [8][11][8]. Production tags are not evenly loaded, and the hot ones will move both sides of the comparison.
The two inputs are the ones TigerData names: how often that query runs, and how much ingest headroom is left [2]. Frequent query, headroom to spare, add it. Frequent query, no headroom, and the dashboard is being funded out of the write path, where the guide puts the next ceiling three to six months out [5]. Rare query with headroom, harmless until the fifth index [4]. Rare query, no headroom, drop it. Before any of that, check that some query filters on the leading column, because when none does the index is pure write cost [16]. This is written for whoever answers for ingest capacity. TigerData also notes that Postgres reads B-trees in both directions, so the explicit DESC in (tag_id, ts DESC) matters only on mixed-direction sorts [17].
What to watch
- Whether teams that audit their highest-ingest tables find indexes whose leading column no query filters on.
- Whether the guide's measurement queries let an operator put a WAL-bytes-per-row figure beside the buffer saving.
- Whether the four reductions TigerData promises without schema changes hold on skewed production tags.