Invest1 distinct publisher2 min readPublished
The state with the least employer coverage in the country lost the most marketplace members and one of the smallest shares of them. That combination is what insurers elsewhere price against in 2027.
The Investor · Invest desk

Compiled by The InvestorSomething wrong?How this is made
The number doing the work here is not an ACA number. At 40%, Florida has the smallest share of its workforce covered through an employer of any state [1], it carries one of the highest under-65 uninsured rates [13], and more than a fifth of its residents under 65 buy through the marketplace against 7% nationally [2]. That describes a population without a second door. When the price went up, most Florida enrollees stayed on the plan and absorbed it, which is how the state produced the largest headcount loss in the country off a shallower percentage decline than its peers [5].
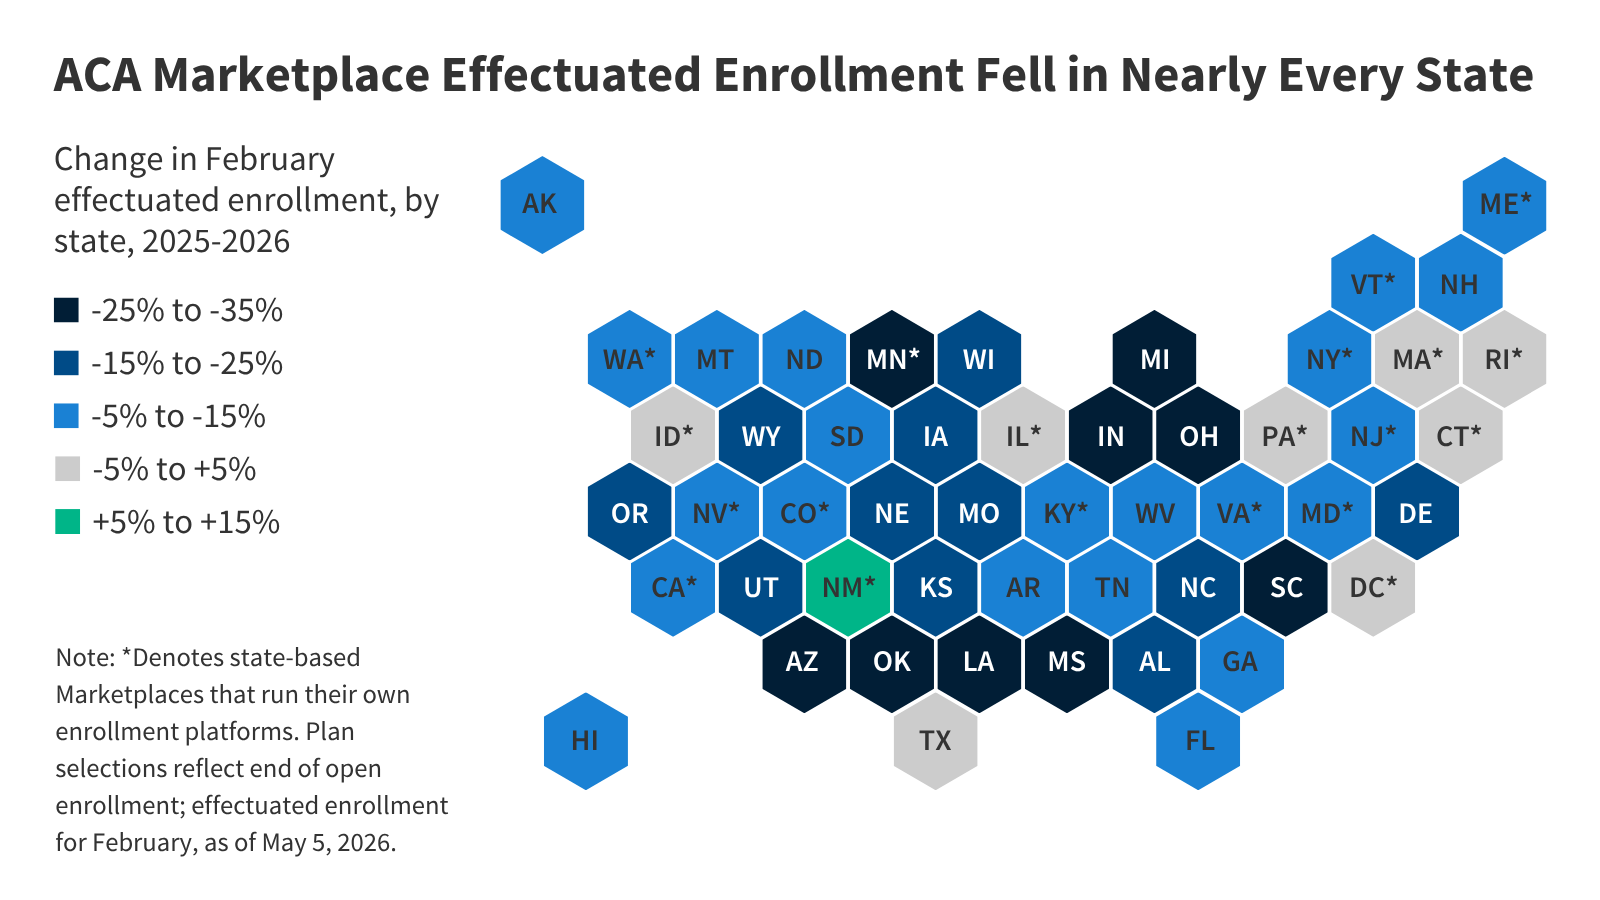
Compare the states that share its dependence on the marketplace. Among the seven with the highest proportional enrollment, South Carolina lost 29% of enrollees, Mississippi 26%, Alabama 23% and Utah 16% [12]. Those markets did not only get more expensive, they got smaller. The KFF figures cover effectuated enrollment for January and February 2026 [3], which means headcount and nothing about the health status of the people who stopped paying.
The arithmetic around the federal explanation is worth doing slowly. National effectuated enrollment ran from 13.5 million in 2022 to 21.8 million in 2025 [10], so the fall to 19.1 million is a net decline of about 2.7 million [4]. The June 2026 HHS report counts nearly 3 million people subsidized in 2025 who lost coverage in 2026 [8], which is more than the net; roughly 300,000 offsetting enrollments sit in that gap [6]. And the cohort the report treats as wrongly subsidized, those above 400% of poverty who became eligible in 2021, was 10% of enrollees [9], or about 2.18 million at 2025 volumes, fewer people than actually left [5]. On the same figures, only about a third of the 2022-to-2025 enrollment gain has come back out [7].
That leaves Florida as the closest thing to a controlled reading of price sensitivity in this market, because substitution into job-based coverage is least available there. Anyone pricing 2027 individual business in a state with a real employer backstop is treating Florida's shallow decline as a floor, and hoping it is not flattered by a two-month snapshot taken before mid-year non-payment shows up.
Ranked by verification strength, evidence, and original report placement.
Ohio and Oklahoma tied for the largest state drop in ACA enrollment, at 32% each.
Of the seven states with the highest proportional ACA enrollment, South Carolina lost 29% of enrollees, Mississippi 26%, Alabama 23%, and Utah saw a decrease of 16%.
At 40%, Florida has the smallest proportion of its workforce receiving health insurance through their employer in the nation.
Florida has the most individuals insured through the ACA in the nation, with more than 20% of Floridians under age 65 using the ACA, compared with 7% for the nation overall.
Florida has one of the highest rates of individuals under age 65 who are uninsured, and the highest number and proportion of users of ACA insurance subsidies.
In July 2026, KFF reported effectuated ACA enrollment data (people who enrolled and paid a first premium) covering January 2026 through the end of February 2026.
Follow any of these and your For You feed starts watching them — no settings page required.
Evidence-backed comparisons of source perspectives and observed adoption signals. Read the methodology
Which Builder, Operator, and Investor concerns the observed source mix emphasized—not a truth score.
Evidence, demonstrated adoption, hype gap, incentives, and confidence are assessed independently, each on its own current evidence. How these are measured.
Specific numbers, one publisher, one snapshot
The quantitative core is unusually concrete for a single-item cluster: named data provider (KFF), a defined metric (effectuated enrollment), an explicit measurement window (January-February 2026), state-level breakdowns, and a named government report (June 2026 HHS). It is capped by structural limits - one publisher, no primary documents in the cluster, no Florida-specific premium or uninsured data, and a two-month window standing in for a plan year.
Behavior already realized at scale
This is not prospective uptake - it is a measured population-scale shift in paid coverage. 19.1 million people held effectuated coverage in 2026 against 21.8 million in 2025, Florida moved 4.3 million to 3.85 million, and the metal-tier mix shifted materially from silver to bronze. Adoption of the changed regime is essentially universal among marketplace participants because the premium change applied nationally.
Framing outruns the supplied data on insurer pricing
Modestly overstated, and the overstatement is in the packaging rather than the reporting. The cluster title and dek assert that Florida 'gained weight in the national risk pool' and that this is 'what insurers elsewhere price against in 2027,' but nothing in the supplied material contains rate filings, risk scores, morbidity data or carrier commentary; the share shift is a defensible arithmetic derivation, the pricing consequence is not evidenced. Pulling in the other direction, the article itself deflates earlier alarm - forecasts of 6 million exits and 4.8 million newly uninsured versus 2.7 million exits and 1 in 10 reporting uninsurance - which is why the gap is small rather than large.
Politically interested sourcing on causation
The descriptive enrollment numbers come from KFF, a research group with no direct stake in the outcome. The causal narrative does not: the June 2026 HHS report and administration officials asserting widespread fraud are parties defending the policy change, and the article notes that policy analysts disagree and that partisan politics now shapes how government reports are disseminated. The author is an academic writing analysis rather than a market participant, and the outlet is a business publisher republishing it, so distribution incentives are mild compared with the source incentives on the fraud question.
Solid on counts, thin on causes and consequences
Confidence is moderate: the enrollment and premium magnitudes are specific, internally consistent and attributed to a named research source, so the direction and rough size of the shift are dependable. It is held down by a single-publisher cluster with no primary documents, a two-month measurement window, an unresolved dispute over causation, a residual definitional gap between the HHS 3 million figure and the 2.7 million net decline, and the absence of any insurer-side or Florida-specific data needed to support the forward-looking framing.
invest
Before you shift another dollar of health costs to staff, audit the hospital's calendar1 distinct publisher
leadership
Codify it or lose it: plan for volatility in US China policy, not direction1 distinct publisher
invest
Seven yen, then a giveback: Washington and Tokyo bought time, not a fix1 distinct publisher
invest
A 50% tariff on 5% of the trade: Washington's Section 338 bet lands on American invoices1 distinct publisher
Distinct publishers with included, body-backed reporting in this cluster.
1 article · August 25, 2026