Invest1 distinct publisher3 min readPublished
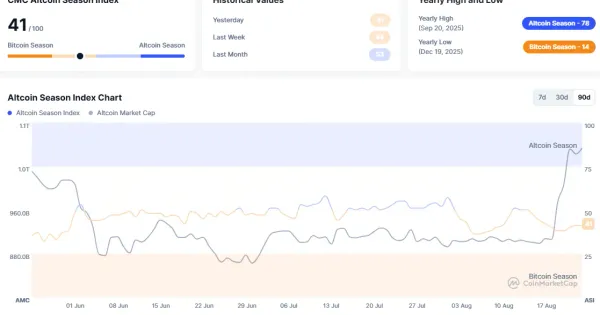
Both trackers measure 90 days, and this rally is seven days old. BlockchainCenter's reading sits at 43 against a threshold of 75, which is a long way from a rotation.
The Investor · Invest desk

Compiled by The InvestorSomething wrong?How this is made
Both gauges are 90-day instruments. BlockchainCenter counts the share of the top 50 coins that beat bitcoin over a rolling quarter, and CoinMarketCap runs the same 75% test across the top 100 [3]. A week of ETH strength therefore enters that measurement as roughly one-thirteenth of the window [2], and it has to do that work against a bitcoin that itself put up 23.25% over the same seven days [6]. Netted out, ETH beat bitcoin by 7.76 percentage points on the week, worth about 6.3% in ETH/BTC terms [1]. That is a good week. It is not a quarter.
The distance left over is the part the rotation talk skips. At 43, BlockchainCenter's reading has to rise about three quarters to reach 75 [3][4], and it is not in bitcoin-season territory either, which CoinMarketCap sets at 25% or fewer of the top 100 beating bitcoin [11]. The reading Cryptopolitan itself cited back in June was 49, six points above the number in the body of its current report [9][17]. Whatever has happened over those months, the gauge has gone backwards.
Breadth is where the thesis actually fails. XRP is up about 49% and Zcash about 64% on the week, the two names the source identifies as outrunning ETH [8]. That is the pattern CryptoQuant's Darkfrost described earlier in the year: alts tightly correlated to bitcoin, so a strong bitcoin no longer lifts the tail with it [19]. Bitcoin still holds over 59% of total market value against ETH's 11.4% [7], a share roughly 5.2 times larger [7], and BlockchainCenter's own count puts the last altcoin season more than 332 days back, close to eleven months [10][8].
Arthur Hayes is the loudest counterweight, and his case is explicitly conditional. He told Laura Shin that ETH is his second-largest holding after bitcoin and that its failure to reclaim the 2021 high leaves room to catch up, with less risk of going to zero than smaller tokens [14]; on the Altcoin Daily podcast he said ETH would outperform every other large cap in this liquidity-driven rebound and could pull bitcoin dominance toward 40% [16]. From above 59%, that is more than 19 points of share, about a third of bitcoin's current weight [4]. His own trigger is a decisive break above $3,000, roughly 20% above the current print, with $5,000 around a double from here [15][5][6].
Meanwhile the bullish data on offer measures positioning rather than performance. Glassnode wrote on 24 August that 85% of alts had pushed funding rates above their mean, the highest reading since bitcoin traded at all-time highs, and that such conditions can persist for weeks in an alt season [13]. Funding tells you what leverage is paying to hold, not what has beaten bitcoin over 90 days, and CoinMarketCap's Fear and Greed sits at 80 out of 100 [9]. On 30 June, more than 84% of altcoins were below their 200-day moving average, the longest such run since the 2022 bear market [18]. Until the rolling window turns, what is on the tape is a bitcoin quarter with an ETH week inside it.
Ranked by verification strength, evidence, and original report placement.
Cryptopolitan reported in June that altcoin selling had reached all-time highs, with the season index at 49.
Cryptopolitan reported on June 30 that more than 84% of altcoins were trading below their 200-day moving average, the longest such stretch since the 2022 bear market.
Ethereum trades around $2,494.68, up 2.59% over 24 hours and 31.01% over the past seven days, per CoinMarketCap data.
Neither CoinMarketCap nor BlockchainCenter is calling an altcoin season despite Ethereum's seven-day run.
Both indexes require at least 75% of top coins to beat Bitcoin over a rolling 90 days; CoinMarketCap uses the top 100 and BlockchainCenter the top 50.
Follow any of these and your For You feed starts watching them — no settings page required.
Evidence-backed comparisons of source perspectives and observed adoption signals. Read the methodology
Which Builder, Operator, and Investor concerns the observed source mix emphasized—not a truth score.
Evidence, demonstrated adoption, hype gap, incentives, and confidence are assessed independently, each on its own current evidence. How these are measured.
Single-source market snapshot with an unresolved internal contradiction
Every figure traces to one publisher's reading of third-party dashboards, with no links, timestamps or independent confirmation. The methodology description is specific and checkable, and the ETH-versus-BTC spread follows arithmetically from figures printed side by side, which supports a middling rather than low score. It is capped by the same article reporting BlockchainCenter's index at 43 in the body and 47 in the FAQ, and by the Glassnode datapoint being dated August 24 and measuring funding-rate breadth rather than the 90-day relative performance the gauges score.
No adoption evidence in scope
The cluster contains market prices, index readings, sentiment gauges and analyst commentary. It contains no releases, deployments, integrations, usage disclosures or other adoption events, and inferring capital rotation from a seven-day price move would be exactly the leap the sources decline to make.
Skeptical frame, but unbacked price targets carried without pushback
The report's central claim is deflationary and well matched to its own numbers: the gauges have not triggered, breadth is narrow and dominance has not moved. The overstatement sits in what surrounds it — a $5,000 ETH path and a slide in Bitcoin dominance toward 40%, both presented from a source who has disclosed a large ETH position, with no counter-analysis and with no acknowledgement that the article's own index figure is self-contradictory. Net effect is modestly overstated rather than badly inflated.
Rally-cycle crypto outlet relaying a disclosed holder's targets
The publisher is a crypto trade outlet whose traffic tracks price action; the piece includes a newsletter solicitation and an investment disclaimer, and it repeatedly cites its own prior coverage. The named forecaster has disclosed ETH as his second-largest holding while giving price targets, a direct positional interest. Incentives are visible and partly disclosed rather than hidden, so this is elevated but not extreme.
Moderate: internally checkable claims, no external corroboration
Confidence is limited by a one-publisher cluster and a contradiction the publisher does not resolve, so the precise index level cannot be pinned down. It is supported by the fact that the load-bearing conclusion survives either reading — 43 or 47 both sit far below 75 — and by methodology that is stated clearly enough to verify against the trackers.
invest
Grayscale's Zcash ETF would be a US first, and the 66% run into it was bought on margin1 distinct publisher
invest
Bitcoin's 23.5% week was a Treasury trade, and Treasury can take it back1 distinct publisher
invest
Every FLOP token trading today is unauthorized, and the project's own calendar says so1 distinct publisher
invest
BlackRock took 83 cents of every dollar: the bitcoin ETF surge is one fund's week1 distinct publisher
Distinct publishers with included, body-backed reporting in this cluster.
1 article · August 24, 2026