Science1 distinct publisher2 min readPublished
A framework called MAP encodes 694,246 mechanistic links over 187,089 drugs, then reports up to 12.3% better zero-shot response prediction. Per drug, that graph averages under four edges.
The Scientist · Science desk

Compiled by The ScientistSomething wrong?How this is made
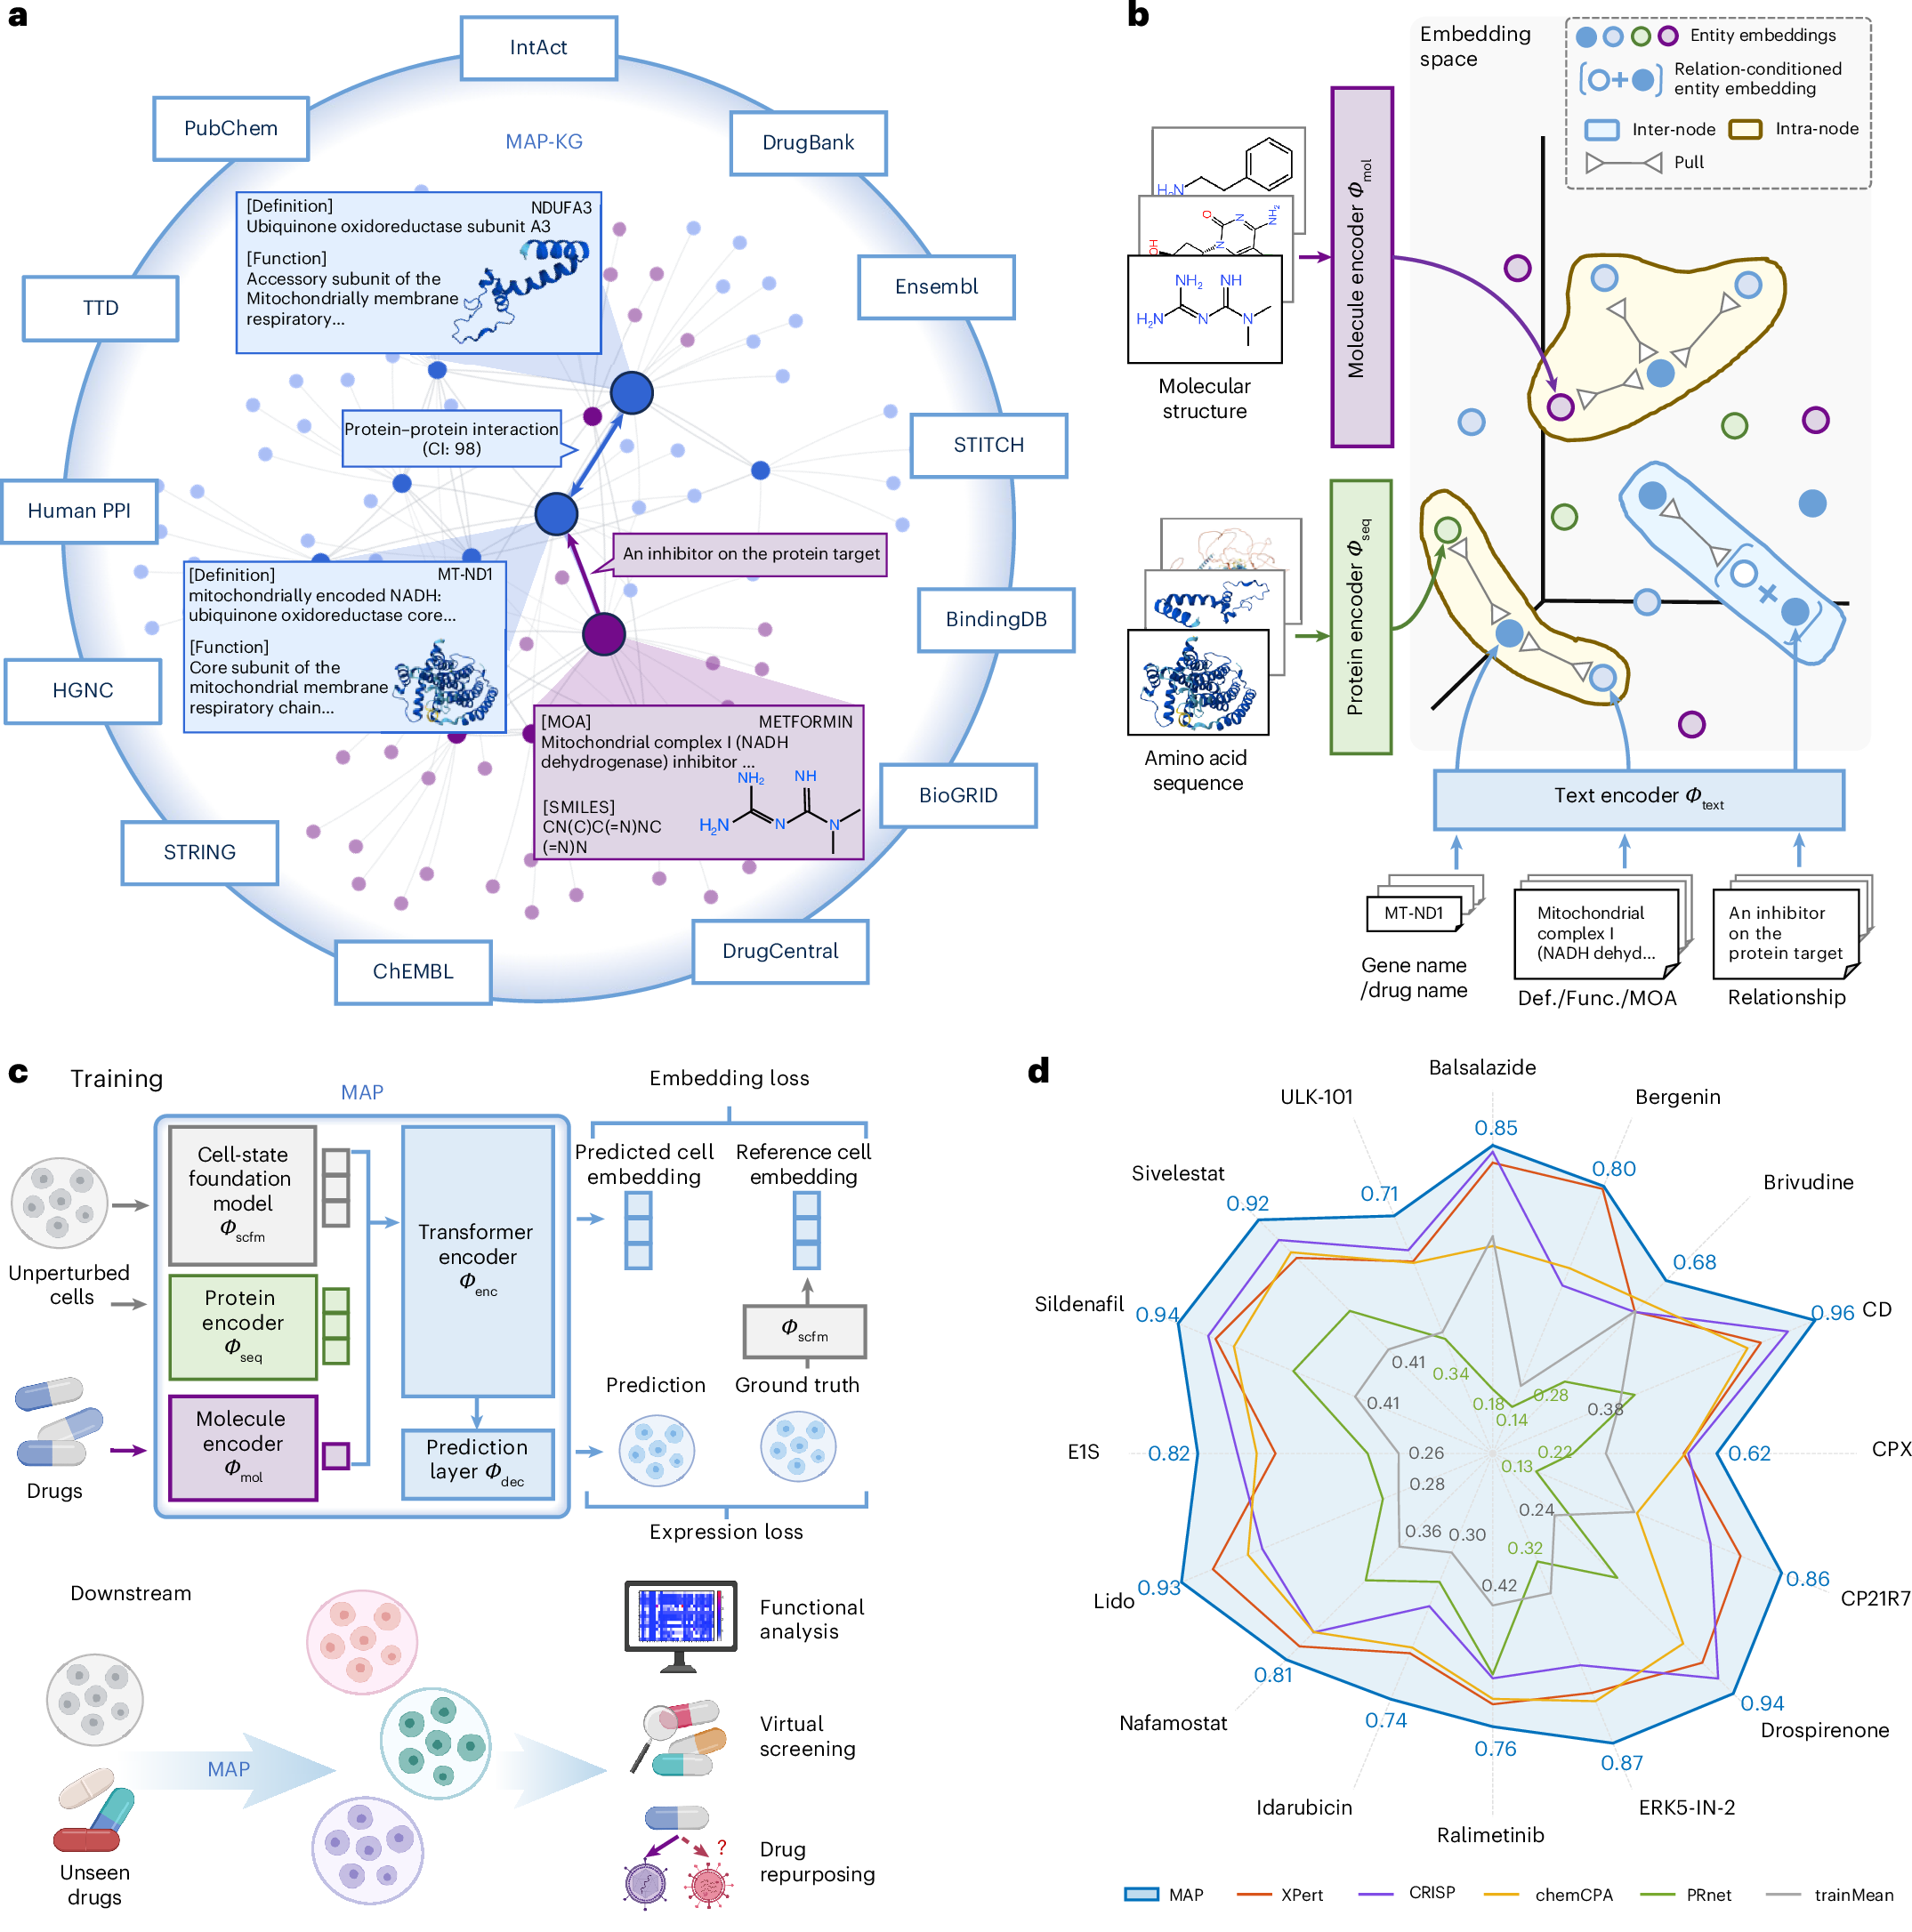
The trick is a substitution, not a new measurement. When a model knows a compound only as a categorical identifier, its neighbours in latent space are whatever co-occurred with it in the training atlas, which is why mechanistically related molecules can end up encoded as unrelated tokens [2]. MAP replaces the token with a position in a space aligned across molecular structure, protein sequence and free-text mechanism [3], and feeds that to a pretrained single-cell foundation model as conditioning [4]. The transcriptional profile is not recovered. It is stood in for by curation, and the paper's own framing of the alternative is that raw descriptors such as structure and targets are heterogeneous and incomplete in practice [9].
So the interesting number is how deep the curation goes. MAP-KG unifies 14 public resources into 187,089 drugs, 22,924 genes and 694,246 mechanistic relationships [1]. That is about 3.7 relationships per drug entry [1], or about 3.3 per node across the whole graph [2]. The abstract does not say how those edges are distributed, and an average of under four is consistent with a small set of heavily annotated drugs carrying most of the mechanistic mass while the long tail arrives with a target or two and little else. For a method whose entire premise is that mechanism substitutes for missing profiles, that distribution is the load-bearing fact, and it is not in the abstract.
The performance claim is stated as a ceiling: up to +12.3% on unseen cell type and drug combinations, up to +11.8% on the stricter unprofiled-drug setting, measured as top-50 differentially expressed gene Pearson delta correlation against the strongest baselines across three benchmarks [5]. Two regimes times three benchmarks is six cells, and "up to" reports the best one. The floor is unstated.
The retrospective screen is the closest thing here to a decision an operator would recognise. Using gene set enrichment analysis, MAP prioritised four of five approved anti-cancer drugs in A-549 non-small-cell lung cancer, and predicted mechanism-consistent programmes for unprofiled candidates [6]. Four of five is one miss [3] out of a set of five, and the abstract does not give the size of the candidate pool those five were ranked within. Without that denominator there is no way to tell enrichment from a short list.
None of which undercuts the framing. Profiled compounds cover only a small fraction of the perturbation space [7], and a virtual cell that cannot score anything outside the atlas is a lookup table with extra steps.
Ranked by verification strength, evidence, and original report placement.
MAP uses a knowledge-driven pretraining strategy that aligns molecular structures, protein sequences and textual mechanistic descriptions into a unified embedding space, producing mechanism-aware and transferable gene and compound embeddings.
Those representations are coupled with a pretrained single-cell foundation model to condition perturbation response prediction.
Evaluated under two zero-shot regimes, unseen cell type-drug combinations and the stricter unprofiled-drug setting, MAP improves top-50 differentially expressed gene Pearson delta correlation by up to +12.3% and up to +11.8% respectively over the strongest baselines across three benchmarks.
MAP-KG is a knowledge graph unifying 14 public resources, spanning 187,089 drugs, 22,924 genes and 694,246 mechanistic relationships.
Existing perturbation models typically treat drugs as isolated or categorical identifiers, placing them in a latent space where proximity is learned from co-occurrence in the training atlas rather than shared mechanism, so mechanistically related compounds may be encoded as unrelated tokens.
Using gene set enrichment analysis for in silico screening, MAP predicted mechanism-consistent programmes on unprofiled candidate drugs and prioritised four out of five approved anti-cancer drugs in A-549 non-small-cell lung cancer.
Follow any of these and your For You feed starts watching them — no settings page required.
Evidence-backed comparisons of source perspectives and observed adoption signals. Read the methodology
Which Builder, Operator, and Investor concerns the observed source mix emphasized—not a truth score.
Evidence, demonstrated adoption, hype gap, incentives, and confidence are assessed independently, each on its own current evidence. How these are measured.
Quantified but single-source and self-reported
The claims rest on one peer-reviewed publication that reports concrete counts, two clearly defined zero-shot regimes, a named metric (top-50 DEG Pearson delta correlation), three benchmarks and a retrospective A-549 screen. That is substantially better than a bare announcement. It is capped, however, by the fact that all evidence comes from the method's own authors in a single source, the benchmarks and baselines are not named in the supplied text, only 'up to' relative gains are given without absolute levels, and no availability or replication information appears.
No adoption signal in supplied sources
The only observable event is the authors' own benchmark reporting inside the publication. The supplied material contains no release of code, weights or the knowledge graph, no third-party use, no deployment, no downstream citation or integration, and no pricing or licensing disclosure. There is no basis for scoring adoption without inferring facts the sources do not contain.
Modestly overstated relative to what is measured
The framing — a mechanistically grounded route to in silico screening at scale, prioritizing therapeutics and dosing before physical experiment and cutting discovery cost and latency — outruns the measurements, which are best-case relative improvements on one correlation metric over unnamed baselines plus a retrospective 4-of-5 recovery in a single cell line. The headline resource counts also read denser than the graph is: about 3.3-3.7 relations per node. The gap is moderate rather than severe because the technical claims are specific, metric-anchored and peer-reviewed, and the paper does hedge its economic claim as conditional on accuracy and generalization.
Author-reported method paper, no disclosure detail supplied
Every claim in the cluster originates from the team that built MAP, evaluating MAP against baselines it selected, with the framing that its approach supersedes prior categorical-identifier and descriptor-conditioning methods — a standard publication incentive to present best-case relative gains. The score stays mid-range because the venue is peer-reviewed and the numbers are explicit and falsifiable, and because the supplied excerpt contains no funding, competing-interest or commercial-affiliation information that would raise or lower this further.
Low-moderate: one peer-reviewed source, no corroboration
Confidence in the technical assertions is helped by peer review, explicit counts and a named evaluation metric, but limited by a single publisher, a truncated excerpt that omits benchmark and baseline identities, absent availability information, no independent replication, and no adoption evidence at all. Derived arithmetic on the paper's own counts is high-confidence; everything about real-world impact is not.
build
The judge is the product: building the scorer for an AI malaria drug leaderboard1 distinct publisher
build
Vivodyne is spending venture money on wet-lab throughput, not bigger models2 distinct publishers
science
A jazz model names the player 94% of the time, and says which part of the playing gave them away3 distinct publishers
invest
Debate wins the agent bake-off, then loses to one model on the same budget1 distinct publisher
Distinct publishers with included, body-backed reporting in this cluster.
1 article · August 25, 2026