Science1 distinct publisher3 min readUpdated
New modelling of Australian office construction finds operating emissions falling from 85 percent of the total to 15 percent by 2049 while embodied emissions stay flat, running 40 percent over 1.5C pathways.
The Scientist · Science desk
Compiled by The ScientistSomething wrong?How this is made
A new study of Australian office buildings, summarised by its authors at phys.org, projects 138 million metric tons of greenhouse gas emissions from that sector alone between 2024 and 2049 [6], which the authors compare to the annual output of 36 coal-fired power stations [7]. The composition of that total is the finding operators should care about: operating emissions were 85 percent of the 2024 figure and fall to 15 percent by 2049 [9], meaning embodied carbon goes from a 15 percent problem to an 85 percent problem over the same period [1].
The reason for the collapse in operating emissions is not building design. It is grid decarbonisation, as Australia shifts from fossil generation to solar, wind and other renewables [10]. Embodied carbon does not get that free ride. If construction continues at current speed and scale, the study finds annual embodied emissions stay at roughly today's levels [11], because material supply chains still run on fossil fuels and carbon-intensive processes [12]. Cement manufacturing alone accounts for 8 percent of global carbon dioxide emissions [13].
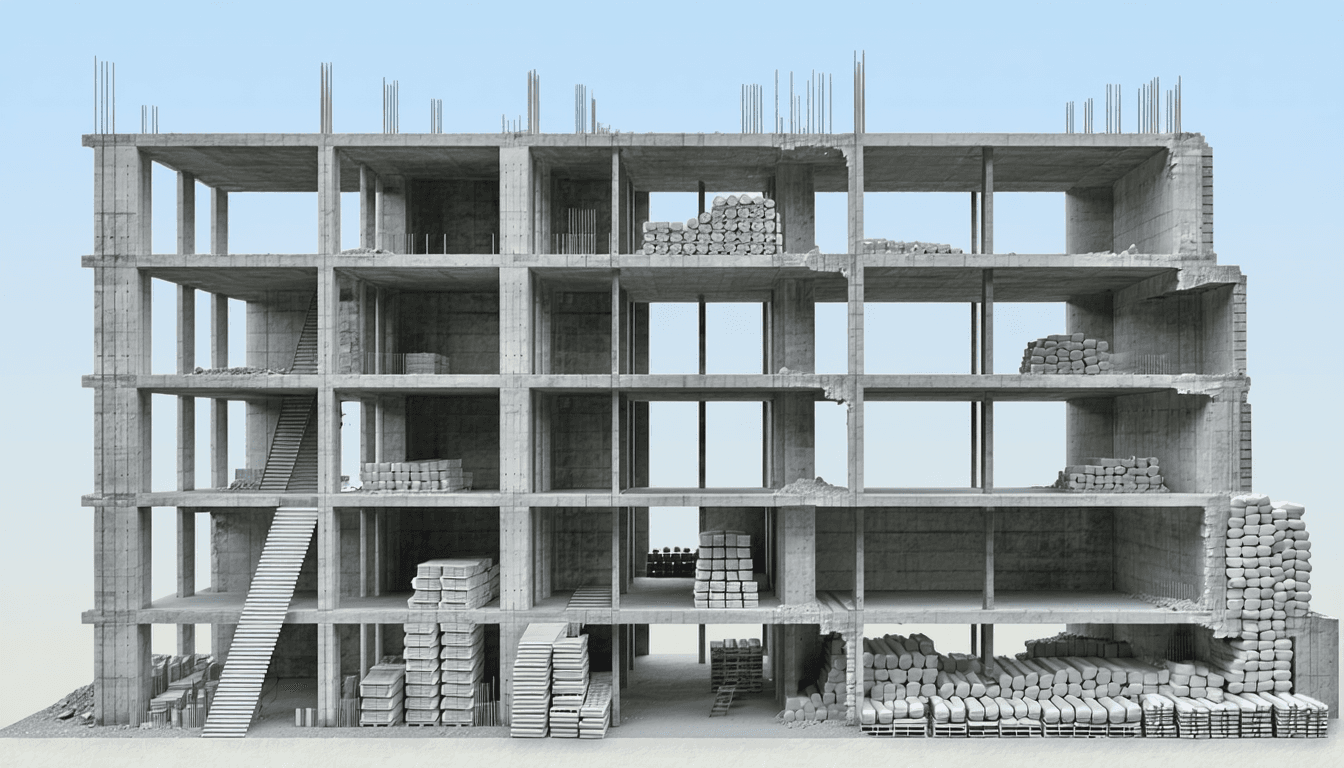
The volumes explain why this is now the binding constraint. Globally, construction adds the equivalent of an entire New York City every month [1], and each square meter of new floor area releases around half a metric ton of greenhouse gases [4]. Australia holds about 170 million square meters of office space and is set to build another 100 million by 2049 [5], a 59 percent addition to the stock [4]. At the half-tonne benchmark, that pipeline is roughly 50 million tons of embodied carbon before anyone switches on a light [2]. Against 1.5C and 2.0C pathways for the sector, cumulative office emissions already run more than 40 percent high, which the authors say means offices will exhaust their carbon budgets within a few years [14].
On mitigation, the paper is more specific about scale than about mechanism. Combining the strategies it modelled could cut more than 47 million metric tons [16], about 34 percent of the projected total [3], moving the sector far closer to the 2.0C pathway [16]. The lever the authors single out is sufficiency: refurbishing existing buildings and constructing smaller or fewer new ones [17]. Their worked example is Sydney's Quay Quarter Tower, a 1976 building that architects 3XN and BVN extended northward while upcycling two-thirds of the original structure, adding office space and saving around 8,000 tons of embodied carbon [18]. At half a tonne per square meter, that saving is equivalent to about 16,000 square meters of new floor area avoided [5]. Notably, the one jurisdiction sitting consistently below the 1.5C pathway is Tasmania, which runs almost entirely on renewables and has fewer offices per capita [15]: a supply-side and a demand-side answer in the same data point.
Two caveats. The published summary does not itemise the individual material substitutions or their separate contributions, so the 47-million-ton figure is a package, not a menu. And offices are only 20 percent of Australian commercial buildings [8], so 138 million tons is a slice of urban emissions, not the whole.
What to watch: whether the crossover the authors expect within the next decade, embodied overtaking operating carbon [19], shows up in procurement rules and building codes as a numeric cap rather than a reporting duty; and whether refurbishment becomes a recognised compliance path where housing targets bite, such as Australia's National Housing Accord goal of 1.2 million homes between 2024 and 2029 [20], against global need estimated at 96,000 new and affordable homes a day [2].
Follow any of these and your For You feed starts watching them — no settings page required.
Ranked by verification strength, evidence, and original report placement.
Constructing one square meter of floor space releases around half a metric ton of greenhouse gas emissions.
Australia has about 170 million square meters of office space and is set to build a further 100 million square meters by 2049.
The study projects Australian office buildings will release 138 million metric tons of greenhouse gas emissions between 2024 and 2049.
The authors state 138 million metric tons is equivalent to the annual emissions of 36 coal-fired power stations.
Offices make up just 20 percent of all commercial buildings in Australia.
Operating emissions represented 85 percent of the total in 2024 but are set to drop to just 15 percent by 2049.
Evidence-backed comparisons of source perspectives and observed adoption signals. Read the methodology
Which Builder, Operator, and Investor concerns the observed source mix emphasized—not a truth score.
Evidence, demonstrated adoption, hype gap, incentives, and confidence are assessed independently, each on its own current evidence. How these are measured.
Peer-reviewed modelling, but only as self-reported by its authors
The quantitative core traces to a named, DOI-identified paper in Building and Environment, which is stronger than a press release or vendor blog. Against that: the cluster contains exactly one item, written by the study team, with no inputs, uncertainty ranges, build-rate sensitivities, or pathway-allocation detail exposed, and no independent modeller or industry check. Several framing figures (a New York City per month, 96,000 homes per day) are asserted without attribution and cannot be verified from the supplied material, while the 0.5 tCO2e per square meter benchmark that anchors much of the arithmetic is presented as an illustrative global average rather than an Australian office-specific factor.
Real precedents abroad and one flagship retrofit; nothing adopted in the studied market
There is concrete, sourced adoption of the prescribed levers outside the study's subject market: five countries regulate embodied carbon, several UK councils run retrofit-first policies, and Quay Quarter Tower is a completed structural-reuse project with a stated 8,000-tonne saving. But adoption of the study's own method or of embodied-carbon limits in Australia is zero by the article's own account, and the cluster supplies no uptake counts, floor-area shares, or compliance outcomes to size any of the foreign policies. Adoption is therefore demonstrable but narrow and unquantified.
Arresting framings run ahead of a scoped, single-study result
The substantive findings are plausible and internally consistent, and the authors do self-limit by noting offices are only 20 percent of Australian commercial buildings. But the presentation reaches for maximal imagery - a New York City every month, 36 coal-fired power stations - built on unattributed or illustrative factors, and the mitigation scenario is reported as a single 47 Mt combined figure without disclosing which strategies deliver it or at what cost. The 'flip to embodied carbon' story is also partly an artefact of grid decarbonisation shrinking the denominator rather than embodied emissions rising, which the text notes but the framing understates. Modest overstatement rather than misrepresentation.
Authors promoting their own paper while lobbying for new regulation
The only source is a The Conversation piece written by the study's authors and republished by phys.org, ending in explicit policy asks: that Australia regulate embodied carbon and offer incentives for refurbishment. Academic authors have visible reputational, funding, and policy-influence incentives to maximise the salience of their own modelling, and the format rewards vivid framing over methodological caveats. Mitigating factors are that the paper is peer-reviewed with a public DOI, the republication licence and authorship are disclosed, and the authors state limits on their own scope. No commercial sponsor, vendor, or asset-owner interest is disclosed or evident in the supplied material.
Single publisher, single author-written source
Confidence is limited structurally rather than by internal inconsistency. One item from one publisher, authored by the interested party, means no cross-source corroboration of any figure and no adversarial check on the modelling or the sufficiency prescription. Directional claims that follow mechanically from grid decarbonisation (embodied carbon's rising share, its greater abatement difficulty) are more reliable than the precise magnitudes (138 Mt, 40 percent overshoot, 47 Mt reduction), which rest wholly on an unexamined model. Freshness is good and the underlying paper is identifiable, which keeps this above the floor.
science
A handful of Texan pumas saved the Florida panther. Genetics is still off the plan.1 distinct publisher
science
Most kingfish carrying the mushy-flesh parasite cook up firm, so the cook test misses them1 distinct publisher
science
H5N1 is in Australian resident birds, and overseas the first wave does most of the killing1 distinct publisher
science
A PNAS study says X's feed learns from your arguments, not your likes2 distinct publishers
Distinct publishers with included, body-backed reporting in this cluster.
1 article · August 21, 2026